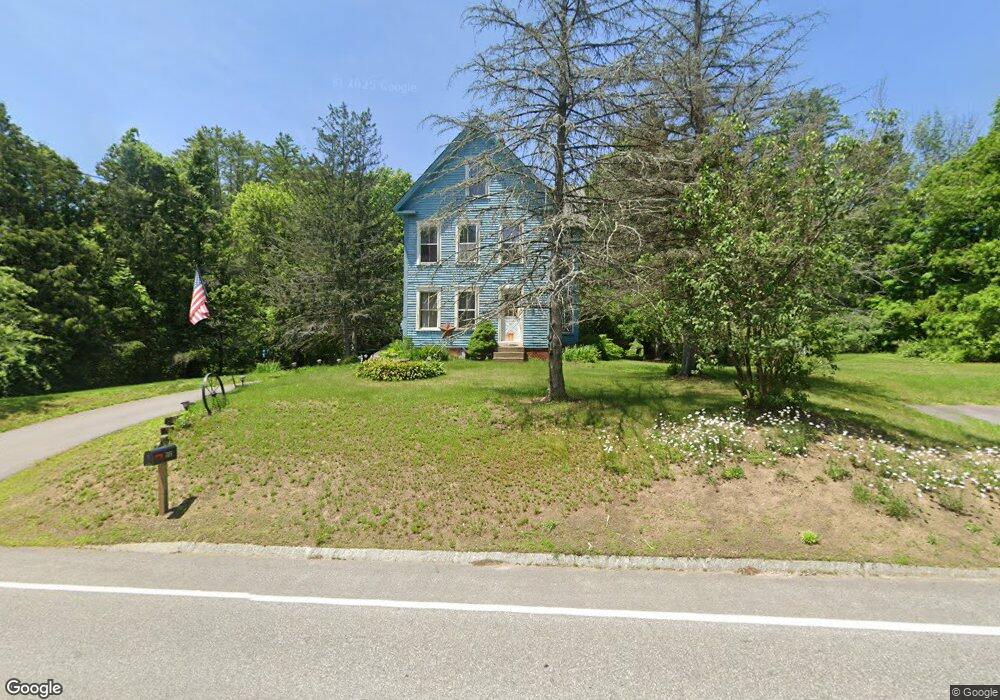
705 S Main St Franklin, NH 03235
Estimated Value: $377,149 - $421,000
3
Beds
1
Bath
1,858
Sq Ft
$212/Sq Ft
Est. Value
About This Home
This home is located at 705 S Main St, Franklin, NH 03235 and is currently estimated at $393,287, approximately $211 per square foot. 705 S Main St is a home located in Merrimack County with nearby schools including Paul A. Smith School, Franklin Middle School, and Franklin High School.
Ownership History
Date
Name
Owned For
Owner Type
Purchase Details
Closed on
Sep 3, 2013
Sold by
Franklin City Of
Bought by
Merrill-Davis Rosemary and Davis Dennis L
Current Estimated Value
Purchase Details
Closed on
Jul 15, 2013
Sold by
Franklin City Of
Bought by
Merrill-Davis Rosemary and Davis Dennis L
Create a Home Valuation Report for This Property
The Home Valuation Report is an in-depth analysis detailing your home's value as well as a comparison with similar homes in the area
Home Values in the Area
Average Home Value in this Area
Purchase History
| Date | Buyer | Sale Price | Title Company |
|---|---|---|---|
| Merrill-Davis Rosemary | -- | -- | |
| Merrill-Davis Rosemary | -- | -- |
Source: Public Records
Tax History Compared to Growth
Tax History
| Year | Tax Paid | Tax Assessment Tax Assessment Total Assessment is a certain percentage of the fair market value that is determined by local assessors to be the total taxable value of land and additions on the property. | Land | Improvement |
|---|---|---|---|---|
| 2024 | $4,960 | $289,200 | $96,600 | $192,600 |
| 2023 | $4,702 | $289,200 | $96,600 | $192,600 |
| 2022 | $4,088 | $167,600 | $74,500 | $93,100 |
| 2021 | $3,890 | $167,600 | $74,500 | $93,100 |
| 2020 | $7,936 | $167,600 | $74,500 | $93,100 |
| 2019 | $7,905 | $167,600 | $74,500 | $93,100 |
| 2018 | $7,416 | $167,600 | $74,500 | $93,100 |
| 2017 | $3,724 | $145,700 | $40,700 | $105,000 |
| 2016 | $3,676 | $145,700 | $40,700 | $105,000 |
| 2015 | $2,545 | $101,990 | $28,490 | $73,500 |
| 2011 | $3,798 | $176,500 | $41,400 | $135,100 |
Source: Public Records
Map
Nearby Homes
- 27 A St
- 10 Upland Dr
- 00 Smith Hill Rd Unit 401
- 593 Prospect St
- 603 Prospect St
- 213 S Main St
- 84 Gile Rd
- 140 Summit St
- 82-84 Woodridge Rd
- 526 Salisbury Rd
- 157 Summit St
- 135 Franklin St
- 123 Franklin St
- 152 Prospect St
- 187 Summit St
- 88 Franklin St
- 75 School St
- 28 Leach Ave
- 416 Central St
- 99 Pleasant St
- 673 S Main St
- 665 S Main St
- 735 S Main St
- 635 S Main St
- 745 S Main St
- 761 S Main St
- 00 Industrial Park Dr
- 5 SE Built (Survey Says Proposed ) Dr
- 605 S Main St
- 602 S Main St
- 0 Industrial Park Dr
- 70 Industrial Park Dr
- 70 Industrial Park Dr
- 70 Industrial Park Dr Unit 1
- 70 Industrial Park Dr Unit 4
- 70 Industrial Park Dr Unit 5
- 70 Industrial Park Dr Unit 5
- 70 Industrial Park Dr Unit 4
- 70 Industrial Park Dr
- 70 Industrial Park Dr Unit 1