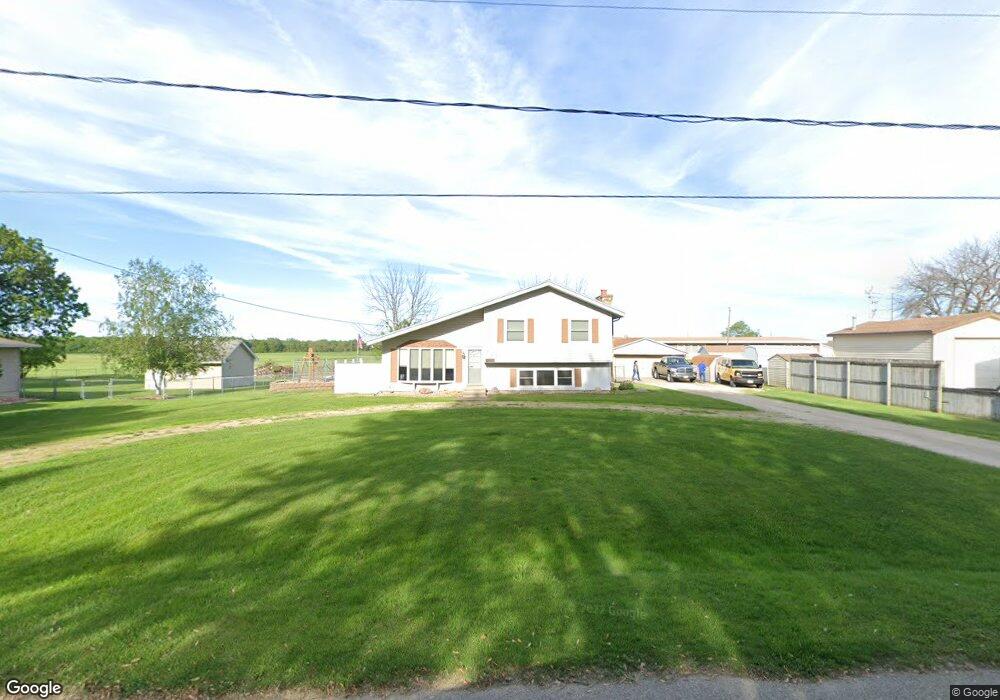
707 Belle St Waterloo, IA 50702
Estimated Value: $217,000 - $242,000
3
Beds
2
Baths
1,084
Sq Ft
$213/Sq Ft
Est. Value
About This Home
This home is located at 707 Belle St, Waterloo, IA 50702 and is currently estimated at $230,426, approximately $212 per square foot. 707 Belle St is a home located in Black Hawk County with nearby schools including Orange Elementary School, Hoover Middle School, and West High School.
Ownership History
Date
Name
Owned For
Owner Type
Purchase Details
Closed on
Nov 6, 2013
Sold by
Cole Don H and Cole Carolyn K
Bought by
Cole Michael L
Current Estimated Value
Home Financials for this Owner
Home Financials are based on the most recent Mortgage that was taken out on this home.
Original Mortgage
$133,200
Outstanding Balance
$35,549
Interest Rate
4.24%
Mortgage Type
New Conventional
Estimated Equity
$194,877
Purchase Details
Closed on
Mar 1, 2010
Sold by
Cole Don H and Cole Caroiyn K
Bought by
Cole Michael L
Purchase Details
Closed on
Jul 1, 2007
Sold by
Cole Don H and Cole Carolyn K
Bought by
Cole Michael L
Create a Home Valuation Report for This Property
The Home Valuation Report is an in-depth analysis detailing your home's value as well as a comparison with similar homes in the area
Home Values in the Area
Average Home Value in this Area
Purchase History
| Date | Buyer | Sale Price | Title Company |
|---|---|---|---|
| Cole Michael L | $145,000 | None Available | |
| Cole Michael L | $1,204,000 | None Available | |
| Cole Michael L | $145,000 | None Available |
Source: Public Records
Mortgage History
| Date | Status | Borrower | Loan Amount |
|---|---|---|---|
| Open | Cole Michael L | $133,200 |
Source: Public Records
Tax History Compared to Growth
Tax History
| Year | Tax Paid | Tax Assessment Tax Assessment Total Assessment is a certain percentage of the fair market value that is determined by local assessors to be the total taxable value of land and additions on the property. | Land | Improvement |
|---|---|---|---|---|
| 2024 | $3,998 | $202,940 | $31,550 | $171,390 |
| 2023 | $3,336 | $202,940 | $31,550 | $171,390 |
| 2022 | $3,246 | $164,180 | $31,550 | $132,630 |
| 2021 | $3,250 | $164,180 | $31,550 | $132,630 |
| 2020 | $3,192 | $155,390 | $25,240 | $130,150 |
| 2019 | $3,192 | $155,390 | $25,240 | $130,150 |
| 2018 | $3,192 | $155,260 | $25,240 | $130,020 |
| 2017 | $3,296 | $155,260 | $25,240 | $130,020 |
| 2016 | $3,248 | $155,260 | $25,240 | $130,020 |
| 2015 | $3,248 | $155,260 | $25,240 | $130,020 |
| 2014 | $3,512 | $163,900 | $25,240 | $138,660 |
Source: Public Records
Map
Nearby Homes