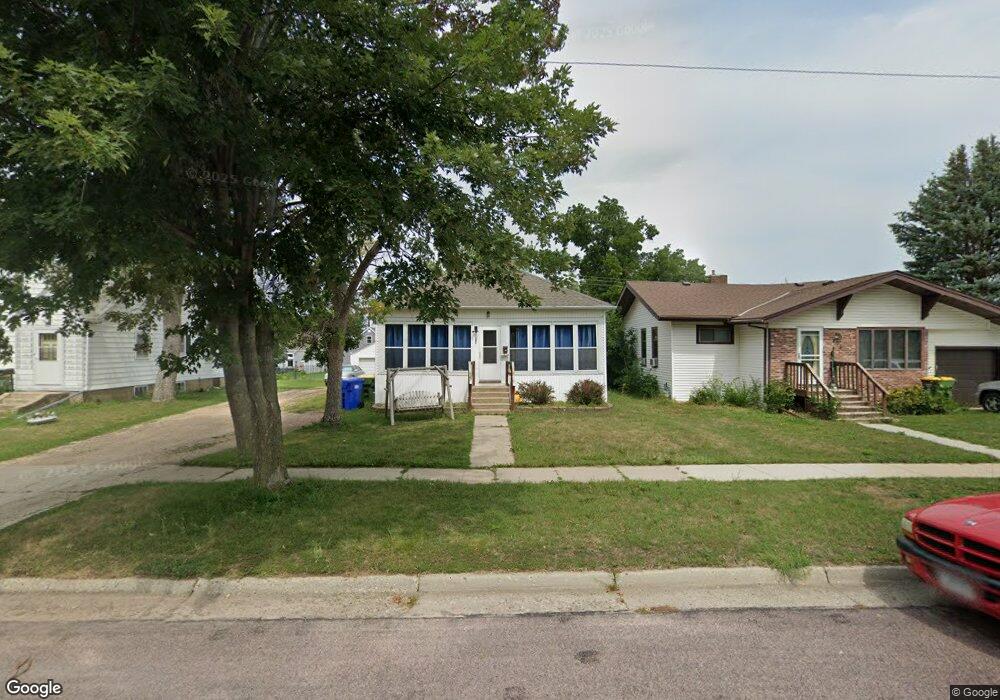
707 W Main St Pipestone, MN 56164
Estimated Value: $84,000 - $113,251
2
Beds
2
Baths
1,073
Sq Ft
$94/Sq Ft
Est. Value
About This Home
This home is located at 707 W Main St, Pipestone, MN 56164 and is currently estimated at $101,313, approximately $94 per square foot. 707 W Main St is a home located in Pipestone County with nearby schools including Pipestone Elementary School, Brown Elementary School, and Heartland Elementary School.
Ownership History
Date
Name
Owned For
Owner Type
Purchase Details
Closed on
Dec 29, 2017
Sold by
Onken Mark and Onken Andrea
Bought by
Onken Doug
Current Estimated Value
Purchase Details
Closed on
May 22, 2014
Sold by
Carrow Laura L and Wurster Eric
Bought by
Aubert Aaron C
Home Financials for this Owner
Home Financials are based on the most recent Mortgage that was taken out on this home.
Original Mortgage
$39,900
Outstanding Balance
$30,191
Interest Rate
4.14%
Estimated Equity
$71,122
Purchase Details
Closed on
Feb 21, 2006
Sold by
Eckhoff Lee and Eckhoff Toni
Bought by
Carrow Laura L
Home Financials for this Owner
Home Financials are based on the most recent Mortgage that was taken out on this home.
Original Mortgage
$35,300
Interest Rate
6.22%
Create a Home Valuation Report for This Property
The Home Valuation Report is an in-depth analysis detailing your home's value as well as a comparison with similar homes in the area
Home Values in the Area
Average Home Value in this Area
Purchase History
| Date | Buyer | Sale Price | Title Company |
|---|---|---|---|
| Onken Doug | $55,000 | None Available | |
| Aubert Aaron C | -- | Pipestone Abstract And Title | |
| Aubert Aaron Aaron | $40,400 | -- | |
| Carrow Laura L | -- | -- |
Source: Public Records
Mortgage History
| Date | Status | Borrower | Loan Amount |
|---|---|---|---|
| Open | Aubert Aaron Aaron | $39,900 | |
| Closed | Aubert Aaron C | $41,224 | |
| Previous Owner | Carrow Laura L | $35,300 |
Source: Public Records
Tax History Compared to Growth
Tax History
| Year | Tax Paid | Tax Assessment Tax Assessment Total Assessment is a certain percentage of the fair market value that is determined by local assessors to be the total taxable value of land and additions on the property. | Land | Improvement |
|---|---|---|---|---|
| 2025 | $874 | $90,200 | $6,600 | $83,600 |
| 2024 | $874 | $87,600 | $6,600 | $81,000 |
| 2023 | $760 | $79,900 | $6,600 | $73,300 |
| 2022 | $710 | $66,500 | $4,700 | $61,800 |
| 2021 | $712 | $58,400 | $4,700 | $53,700 |
| 2020 | $460 | $57,200 | $4,700 | $52,500 |
| 2019 | $436 | $38,700 | $4,000 | $34,700 |
| 2018 | $402 | $36,700 | $4,000 | $32,700 |
| 2017 | $712 | $34,400 | $4,000 | $30,400 |
| 2016 | $632 | $0 | $0 | $0 |
| 2015 | $506 | $41,200 | $4,000 | $37,200 |
| 2014 | $506 | $24,900 | $2,400 | $22,500 |
Source: Public Records
Map
Nearby Homes