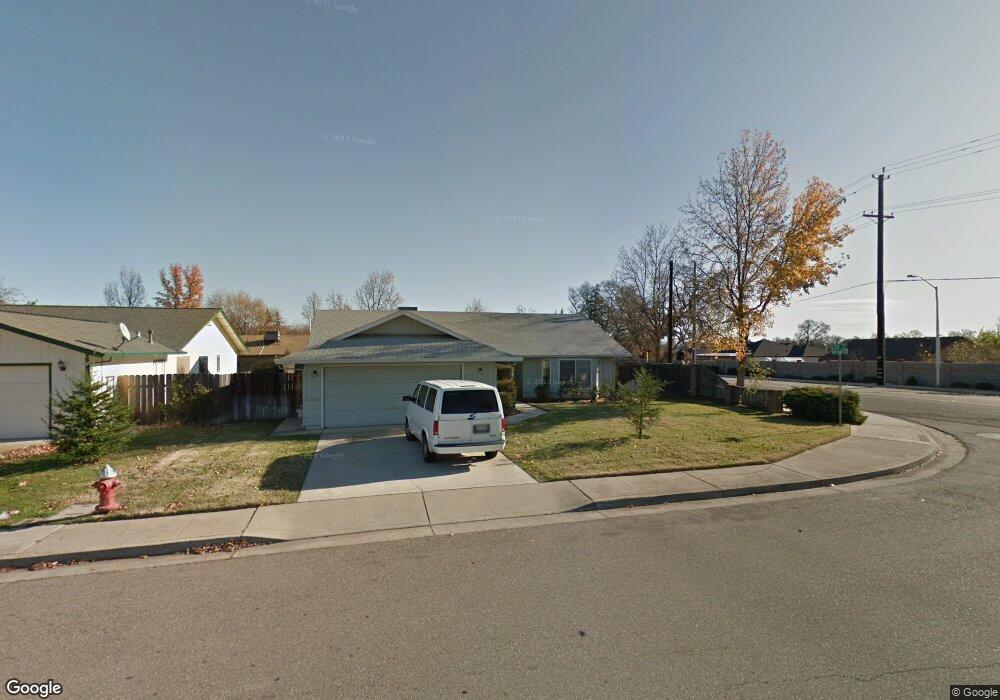
7079 Pit Rd Redding, CA 96001
Girvan NeighborhoodEstimated Value: $291,384 - $354,000
4
Beds
2
Baths
1,600
Sq Ft
$206/Sq Ft
Est. Value
About This Home
This home is located at 7079 Pit Rd, Redding, CA 96001 and is currently estimated at $329,846, approximately $206 per square foot. 7079 Pit Rd is a home located in Shasta County with nearby schools including Bonny View Elementary School, Sequoia Middle School, and Shasta High School.
Ownership History
Date
Name
Owned For
Owner Type
Purchase Details
Closed on
Apr 22, 2022
Sold by
Rhodes Angela E
Bought by
Angela E Rhodes Trust
Current Estimated Value
Purchase Details
Closed on
Apr 3, 2021
Sold by
Rhodes Angela
Bought by
Rhodes Angela E
Home Financials for this Owner
Home Financials are based on the most recent Mortgage that was taken out on this home.
Original Mortgage
$220,500
Interest Rate
2.9%
Mortgage Type
New Conventional
Purchase Details
Closed on
May 18, 2001
Sold by
Little Ronald David and Little Donna Fong
Bought by
Rhodes James and Rhodes Angela
Home Financials for this Owner
Home Financials are based on the most recent Mortgage that was taken out on this home.
Original Mortgage
$80,000
Interest Rate
7.15%
Create a Home Valuation Report for This Property
The Home Valuation Report is an in-depth analysis detailing your home's value as well as a comparison with similar homes in the area
Home Values in the Area
Average Home Value in this Area
Purchase History
| Date | Buyer | Sale Price | Title Company |
|---|---|---|---|
| Angela E Rhodes Trust | -- | Campbell Clark & Vienneau Apc | |
| Rhodes Angela E | -- | Fidelity Natl Ttl Co Of Ca | |
| Rhodes James | $100,000 | Fidelity National Title Co |
Source: Public Records
Mortgage History
| Date | Status | Borrower | Loan Amount |
|---|---|---|---|
| Previous Owner | Rhodes Angela E | $220,500 | |
| Previous Owner | Rhodes James | $80,000 |
Source: Public Records
Tax History
| Year | Tax Paid | Tax Assessment Tax Assessment Total Assessment is a certain percentage of the fair market value that is determined by local assessors to be the total taxable value of land and additions on the property. | Land | Improvement |
|---|---|---|---|---|
| 2025 | $1,581 | $150,656 | $42,178 | $108,478 |
| 2024 | $1,557 | $147,702 | $41,351 | $106,351 |
| 2023 | $1,557 | $144,807 | $40,541 | $104,266 |
| 2022 | $1,530 | $141,969 | $39,747 | $102,222 |
| 2021 | $1,523 | $139,186 | $38,968 | $100,218 |
| 2020 | $1,542 | $137,760 | $38,569 | $99,191 |
| 2019 | $1,465 | $135,060 | $37,813 | $97,247 |
| 2018 | $1,477 | $132,413 | $37,072 | $95,341 |
| 2017 | $1,469 | $129,818 | $36,346 | $93,472 |
| 2016 | $1,423 | $127,274 | $35,634 | $91,640 |
| 2015 | $1,405 | $125,363 | $35,099 | $90,264 |
| 2014 | $1,395 | $122,908 | $34,412 | $88,496 |
Source: Public Records
Map
Nearby Homes
- 7060 Pit Rd
- 6955 Yvonne Ct
- 7022 Marvin Trail
- 7253 Legacy
- 6871 Hemlock St
- 7420 Platinum Way
- 0 Waverly Manor
- 6733 El Camino Dr
- 7728 Pit Rd
- 6551 El Camino Dr
- 6624 Southgate Dr
- 6725 Reflection St
- 2850 Balaton Ave
- 2890 Balaton Ave
- 6405 El Camino Dr
- 3182 Island Dr
- 8641 Redbank Rd
- 2339 North Dr
- 6958 Riverside Dr
- 2048 Wilder Dr
- 7067 Pit Rd
- 7064 David Trail
- 2601 Marvin Trail
- 7055 Pit Rd
- 7072 Pit Rd
- 2206 Lonigan
- 7043 Pit Rd
- 7058 David Trail
- 2611 Marvin Trail
- 7119 Pit
- 7046 David Trail
- 7110 Pit Rd
- 7035 Pit Rd
- 2266 Lonigan Ct
- 2567 Penelope St
- 2580 Penelope St
- 2623 Marvin 1weup7o4x02b
- 7120 Pit Rd Unit 1
- 7034 David Trail
- 2620 Marvin Trail
Your Personal Tour Guide
Ask me questions while you tour the home.