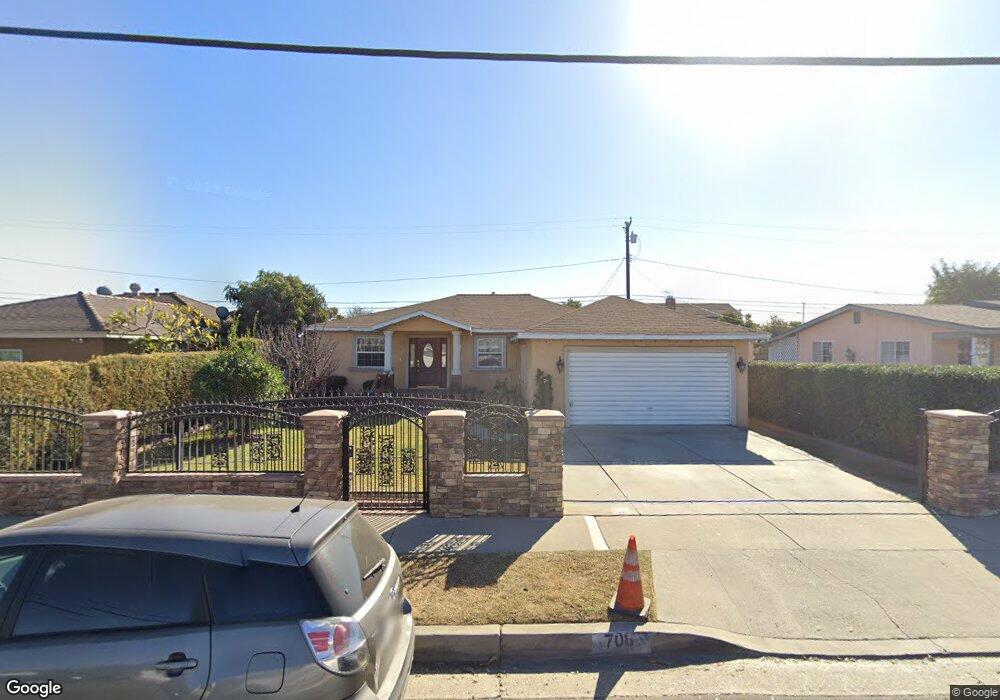
708 Willow Ave La Puente, CA 91746
Estimated Value: $706,000 - $798,000
3
Beds
2
Baths
1,337
Sq Ft
$559/Sq Ft
Est. Value
About This Home
This home is located at 708 Willow Ave, La Puente, CA 91746 and is currently estimated at $747,878, approximately $559 per square foot. 708 Willow Ave is a home located in Los Angeles County with nearby schools including Lassalette Middle School, La Puente High School, and St. Louis of France School.
Ownership History
Date
Name
Owned For
Owner Type
Purchase Details
Closed on
May 13, 2002
Sold by
Zendejas Michael
Bought by
Zendejas Michael and Zendejas Claudia J
Current Estimated Value
Purchase Details
Closed on
Oct 13, 1999
Sold by
Summerlin Leticia
Bought by
Summerlin Paul A
Home Financials for this Owner
Home Financials are based on the most recent Mortgage that was taken out on this home.
Original Mortgage
$146,750
Outstanding Balance
$44,039
Interest Rate
7.75%
Mortgage Type
FHA
Estimated Equity
$703,839
Purchase Details
Closed on
Oct 12, 1999
Sold by
Summerlin Paul A
Bought by
Zendejas Michael and Munoz Jose M
Home Financials for this Owner
Home Financials are based on the most recent Mortgage that was taken out on this home.
Original Mortgage
$146,750
Outstanding Balance
$44,039
Interest Rate
7.75%
Mortgage Type
FHA
Estimated Equity
$703,839
Create a Home Valuation Report for This Property
The Home Valuation Report is an in-depth analysis detailing your home's value as well as a comparison with similar homes in the area
Home Values in the Area
Average Home Value in this Area
Purchase History
| Date | Buyer | Sale Price | Title Company |
|---|---|---|---|
| Zendejas Michael | -- | -- | |
| Summerlin Paul A | -- | Chicago Title | |
| Zendejas Michael | $148,000 | Chicago Title |
Source: Public Records
Mortgage History
| Date | Status | Borrower | Loan Amount |
|---|---|---|---|
| Open | Zendejas Michael | $146,750 |
Source: Public Records
Tax History
| Year | Tax Paid | Tax Assessment Tax Assessment Total Assessment is a certain percentage of the fair market value that is determined by local assessors to be the total taxable value of land and additions on the property. | Land | Improvement |
|---|---|---|---|---|
| 2025 | $3,510 | $264,358 | $155,872 | $108,486 |
| 2024 | $3,510 | $259,175 | $152,816 | $106,359 |
| 2023 | $3,423 | $254,094 | $149,820 | $104,274 |
| 2022 | $3,326 | $249,113 | $146,883 | $102,230 |
| 2021 | $3,263 | $244,229 | $144,003 | $100,226 |
| 2019 | $3,172 | $236,987 | $139,733 | $97,254 |
| 2018 | $3,047 | $232,342 | $136,994 | $95,348 |
| 2016 | $2,826 | $223,322 | $131,675 | $91,647 |
| 2015 | $2,774 | $219,969 | $129,698 | $90,271 |
| 2014 | $2,734 | $215,661 | $127,158 | $88,503 |
Source: Public Records
Map
Nearby Homes
- 882 Tamar Dr
- 452 Willow Ave
- 536 Sandsprings Dr
- 731 N Orange Ave
- 416 Mayland Ave
- 544 N Orange Ave Unit B
- 335 Willow Ave
- 14309 Beckner St
- 13622 Hartsville St
- 736 Tonopah Ave
- 1020 League Ave
- 1115 League Ave
- 13833 Fairgrove Ave
- 1003 Le Borgne Ave
- 13802 Cagliero St
- 14641 Lassalette St
- 932 Shadydale Ave
- 1724 W Delvale St
- 1465 Starburst Dr
- 1236 Stichman Ave
Your Personal Tour Guide
Ask me questions while you tour the home.