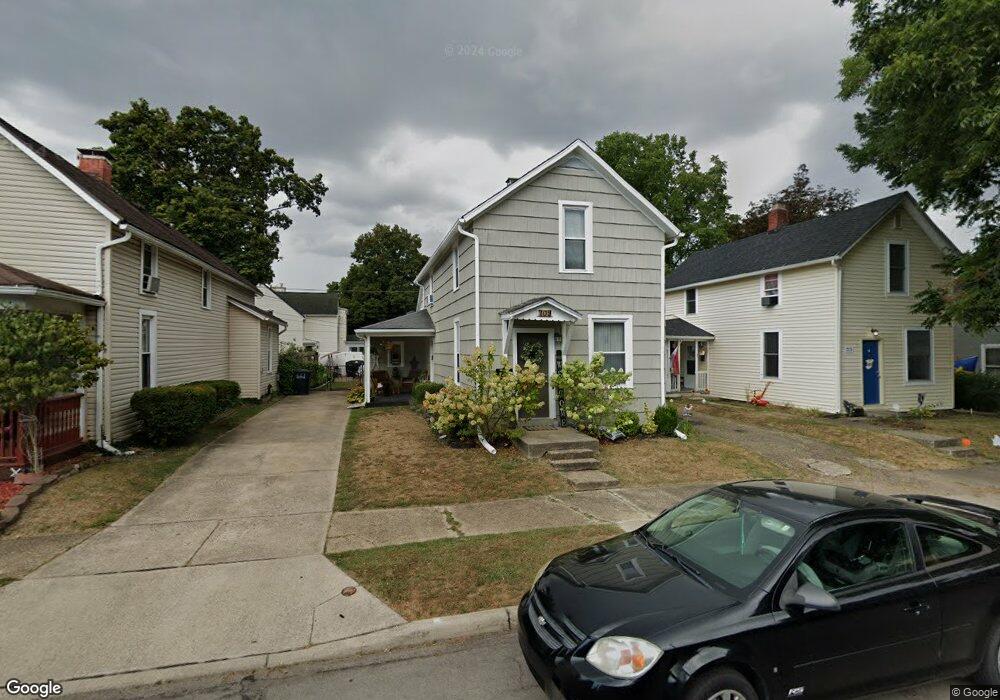
709 N Maple St Lancaster, OH 43130
Estimated Value: $174,000 - $192,000
3
Beds
1
Bath
1,396
Sq Ft
$129/Sq Ft
Est. Value
About This Home
This home is located at 709 N Maple St, Lancaster, OH 43130 and is currently estimated at $180,777, approximately $129 per square foot. 709 N Maple St is a home located in Fairfield County with nearby schools including Thomas Ewing Junior High School, Lancaster High School, and St Mary Elementary School.
Ownership History
Date
Name
Owned For
Owner Type
Purchase Details
Closed on
Aug 11, 2020
Sold by
Aiello Elena M
Bought by
Raver Chelsea
Current Estimated Value
Home Financials for this Owner
Home Financials are based on the most recent Mortgage that was taken out on this home.
Original Mortgage
$96,806
Outstanding Balance
$85,097
Interest Rate
3%
Mortgage Type
New Conventional
Estimated Equity
$95,680
Purchase Details
Closed on
Jul 11, 2016
Sold by
Aiello Elena M and Gallagher Robert H
Bought by
Aiello Elena M
Home Financials for this Owner
Home Financials are based on the most recent Mortgage that was taken out on this home.
Original Mortgage
$65,100
Interest Rate
3.56%
Mortgage Type
New Conventional
Purchase Details
Closed on
Oct 20, 2005
Sold by
Vorhees Allen R and Vorhees Barbara J
Bought by
Gallagher Robert H and Gallagher Elena M
Home Financials for this Owner
Home Financials are based on the most recent Mortgage that was taken out on this home.
Original Mortgage
$76,000
Interest Rate
5.8%
Mortgage Type
Fannie Mae Freddie Mac
Purchase Details
Closed on
Sep 1, 1990
Create a Home Valuation Report for This Property
The Home Valuation Report is an in-depth analysis detailing your home's value as well as a comparison with similar homes in the area
Home Values in the Area
Average Home Value in this Area
Purchase History
We collect this data history from publicly available records. To have your information removed, we recommend requesting removal directly through your county’s website.
| Date | Buyer | Sale Price | Title Company |
|---|---|---|---|
| Raver Chelsea | $99,800 | None Available | |
| Aiello Elena M | -- | Vantage Point Title Inc | |
| Gallagher Robert H | $76,000 | Real Living Title | |
| -- | $37,000 | -- |
Source: Public Records
Mortgage History
We collect this data history from publicly available records. To have your information removed, we recommend requesting removal directly through your county’s website.
| Date | Status | Borrower | Loan Amount |
|---|---|---|---|
| Open | Raver Chelsea | $96,806 | |
| Previous Owner | Aiello Elena M | $65,100 | |
| Previous Owner | Gallagher Robert H | $76,000 |
Source: Public Records
Tax History
| Year | Tax Paid | Tax Assessment Tax Assessment Total Assessment is a certain percentage of the fair market value that is determined by local assessors to be the total taxable value of land and additions on the property. | Land | Improvement |
|---|---|---|---|---|
| 2025 | $3,140 | $53,040 | $12,680 | $40,360 |
| 2024 | $3,140 | $34,930 | $6,110 | $28,820 |
| 2023 | $1,270 | $34,930 | $6,110 | $28,820 |
| 2022 | $1,276 | $34,930 | $6,110 | $28,820 |
| 2021 | $1,237 | $31,730 | $6,110 | $25,620 |
| 2020 | $1,185 | $31,730 | $6,110 | $25,620 |
| 2019 | $1,127 | $31,730 | $6,110 | $25,620 |
| 2018 | $877 | $23,810 | $6,110 | $17,700 |
| 2017 | $877 | $23,460 | $5,880 | $17,580 |
| 2016 | $854 | $23,460 | $5,880 | $17,580 |
| 2015 | $850 | $22,660 | $5,880 | $16,780 |
| 2014 | $810 | $22,660 | $5,880 | $16,780 |
| 2013 | $810 | $22,660 | $5,880 | $16,780 |
Source: Public Records
Map
Nearby Homes
- 617 N Maple St
- 311 E Allen St
- 712 N Mount Pleasant Ave
- 806 N High St
- 615 E 5th Ave
- 539 King St
- 430 N High St
- 338 King St
- 835 Madison Ave
- 901 Madison Ave
- 626 N Broad St
- 430 W Mulberry St
- 338 E Mulberry St
- 1123 N High St
- 537 E Wheeling St
- 246 N Pearl Ave
- 130 W Fair Ave
- 612 Oakwood Ave
- 741 E Mulberry St
- 17 Red Bud Ln
- 437 E Allen St
- 433 E Allen St
- 443 E Allen St
- 720 Edgemont Ave
- 423 E Allen St
- 705 N Maple St
- 713 N Maple St
- 701 N Maple St
- 717 N Maple St
- 726 Edgemont Ave
- 349 E Allen St
- 631 N Maple St
- 721 N Maple St
- 721 Edgemont Ave
- 730 Edgemont Ave
- 629 N Maple St
- 725 N Maple St
- 725 Edgemont Ave
- 444 E Allen St
- 434 E Allen St
Your Personal Tour Guide
Ask me questions while you tour the home.