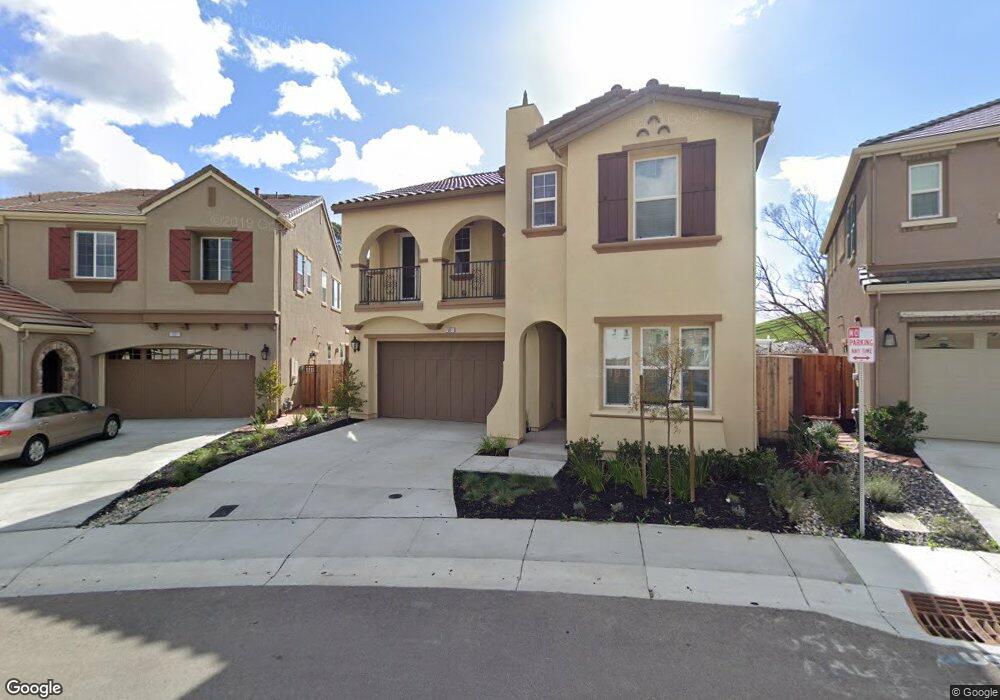
7097 Kylemore Cir Dublin, CA 94568
Estimated Value: $2,093,000 - $2,254,000
4
Beds
3
Baths
3,160
Sq Ft
$689/Sq Ft
Est. Value
About This Home
This home is located at 7097 Kylemore Cir, Dublin, CA 94568 and is currently estimated at $2,177,075, approximately $688 per square foot. 7097 Kylemore Cir is a home with nearby schools including J.M. Amador Elementary School, Dublin High School, and SPRINGFIELD MONTESSORI SCHOOL.
Ownership History
Date
Name
Owned For
Owner Type
Purchase Details
Closed on
Aug 2, 2021
Sold by
Nalamati Madhu
Bought by
Nalamati Madhu
Current Estimated Value
Home Financials for this Owner
Home Financials are based on the most recent Mortgage that was taken out on this home.
Original Mortgage
$1,203,000
Outstanding Balance
$1,087,205
Interest Rate
2.5%
Mortgage Type
New Conventional
Estimated Equity
$1,089,870
Purchase Details
Closed on
Sep 29, 2020
Sold by
Yalamanchili Vijya
Bought by
Nalamati Madhu
Home Financials for this Owner
Home Financials are based on the most recent Mortgage that was taken out on this home.
Original Mortgage
$1,038,766
Interest Rate
3.12%
Mortgage Type
New Conventional
Purchase Details
Closed on
Dec 31, 2018
Sold by
The Enclave Inc
Bought by
Nalamati Madhu and Yalamanchili Vijya
Home Financials for this Owner
Home Financials are based on the most recent Mortgage that was taken out on this home.
Original Mortgage
$1,080,000
Interest Rate
3.62%
Mortgage Type
Adjustable Rate Mortgage/ARM
Create a Home Valuation Report for This Property
The Home Valuation Report is an in-depth analysis detailing your home's value as well as a comparison with similar homes in the area
Purchase History
| Date | Buyer | Sale Price | Title Company |
|---|---|---|---|
| Nalamati Madhu | -- | Fntg Lenders Direct | |
| Nalamati Madhu | -- | Old Republic Title Company | |
| Nalamati Madhu | $1,350,000 | First American Title |
Source: Public Records
Mortgage History
| Date | Status | Borrower | Loan Amount |
|---|---|---|---|
| Open | Nalamati Madhu | $1,203,000 | |
| Closed | Nalamati Madhu | $1,038,766 | |
| Closed | Nalamati Madhu | $1,080,000 |
Source: Public Records
Tax History
| Year | Tax Paid | Tax Assessment Tax Assessment Total Assessment is a certain percentage of the fair market value that is determined by local assessors to be the total taxable value of land and additions on the property. | Land | Improvement |
|---|---|---|---|---|
| 2025 | $19,608 | $1,505,924 | $451,777 | $1,054,147 |
| 2024 | $19,608 | $1,476,400 | $442,920 | $1,033,480 |
| 2023 | $19,411 | $1,447,455 | $434,236 | $1,013,219 |
| 2022 | $19,182 | $1,419,078 | $425,723 | $993,355 |
| 2021 | $19,025 | $1,391,255 | $417,376 | $973,879 |
| 2020 | $17,801 | $1,377,000 | $413,100 | $963,900 |
| 2019 | $12,020 | $883,788 | $85,788 | $798,000 |
| 2018 | $1,175 | $84,106 | $84,106 | $0 |
| 2017 | $1,164 | $82,457 | $82,457 | $0 |
Source: Public Records
Map
Nearby Homes
- 6914 Geyserville St
- 3827 Branding Iron Place
- 4026 Chalk Hill Way
- 3662 Branding Iron Place
- 4022 Windsor Way
- 4067 St Helena Way
- 7228 Carneros Ln
- 7240 Carneros Ln
- 7229 Calistoga Ln
- 7323 Kenwood Rd
- 4386 Healdsburg Way
- 2829 Mount Dana Dr
- 4066 Rosehill Place
- 2848 E Cog Hill Terrace
- 7898 Kennard Ln
- 5653 Signal Hill Dr
- 2890 Sable Oaks Way
- 116 Spalding Ct
- 6183 Kearny Way
- 4958 Trescott Ct
- 7091 Kylemore Cir
- 7103 Kylemore Cir
- 7109 Kylemore Cir
- 7085 Kylemore Cir
- 7102 Kylemore Cir
- 7115 Kylemore Cir
- 7108 Kylemore Cir
- 7079 Kylemore Cir
- 7073 Kylemore Cir
- 7112 Kylemore Cir
- 7121 Kylemore Cir
- 7058 Kylemore Cir
- 7067 Kylemore Cir
- 7132 Kylemore Cir
- 7052 Kylemore Cir
- 7127 Kylemore Cir
- 6960 Tassajara Rd
- 7038 Kylemore Cir
- 7133 Kylemore Cir
- 7061 Kylemore Cir
Your Personal Tour Guide
Ask me questions while you tour the home.