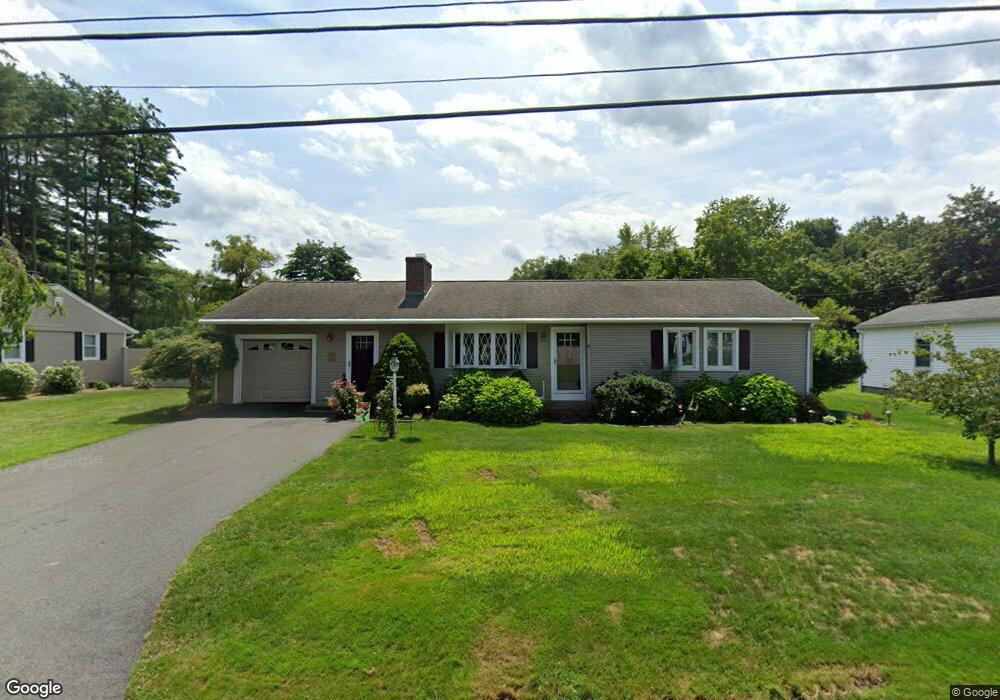
71 Chauncey Dr Springfield, MA 01129
Boston Road NeighborhoodEstimated Value: $310,000 - $356,000
3
Beds
2
Baths
1,724
Sq Ft
$196/Sq Ft
Est. Value
About This Home
This home is located at 71 Chauncey Dr, Springfield, MA 01129 and is currently estimated at $338,058, approximately $196 per square foot. 71 Chauncey Dr is a home located in Hampden County with nearby schools including Warner, M Marcus Kiley Middle, and Springfield Central High School.
Ownership History
Date
Name
Owned For
Owner Type
Purchase Details
Closed on
Jul 30, 1999
Sold by
Chmura Rudolph J and Chmura Elizabeth M
Bought by
Marchetti John C
Current Estimated Value
Home Financials for this Owner
Home Financials are based on the most recent Mortgage that was taken out on this home.
Original Mortgage
$107,508
Interest Rate
7.61%
Mortgage Type
Purchase Money Mortgage
Create a Home Valuation Report for This Property
The Home Valuation Report is an in-depth analysis detailing your home's value as well as a comparison with similar homes in the area
Home Values in the Area
Average Home Value in this Area
Purchase History
| Date | Buyer | Sale Price | Title Company |
|---|---|---|---|
| Marchetti John C | $105,400 | -- |
Source: Public Records
Mortgage History
| Date | Status | Borrower | Loan Amount |
|---|---|---|---|
| Open | Marchetti John C | $25,000 | |
| Open | Marchetti John C | $107,297 | |
| Closed | Marchetti John C | $107,508 | |
| Previous Owner | Marchetti John C | $35,000 |
Source: Public Records
Tax History
| Year | Tax Paid | Tax Assessment Tax Assessment Total Assessment is a certain percentage of the fair market value that is determined by local assessors to be the total taxable value of land and additions on the property. | Land | Improvement |
|---|---|---|---|---|
| 2025 | $5,254 | $335,100 | $64,200 | $270,900 |
| 2024 | $5,220 | $325,000 | $64,200 | $260,800 |
| 2023 | $4,680 | $274,500 | $61,100 | $213,400 |
| 2022 | $4,756 | $252,700 | $61,100 | $191,600 |
| 2021 | $4,564 | $241,500 | $55,600 | $185,900 |
| 2020 | $4,285 | $219,400 | $55,600 | $163,800 |
| 2019 | $3,989 | $202,700 | $55,600 | $147,100 |
| 2018 | $3,964 | $201,400 | $55,600 | $145,800 |
| 2017 | $3,855 | $196,100 | $50,600 | $145,500 |
| 2016 | $3,659 | $186,100 | $50,600 | $135,500 |
| 2015 | $3,623 | $184,200 | $50,600 | $133,600 |
Source: Public Records
Map
Nearby Homes
Your Personal Tour Guide
Ask me questions while you tour the home.