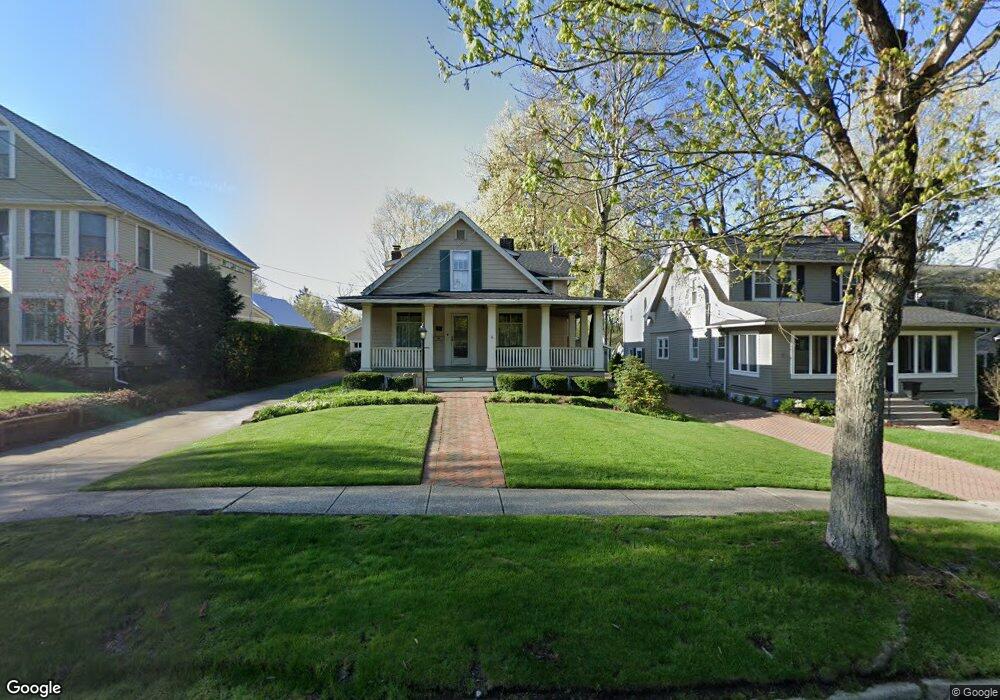
71 Maple St Chagrin Falls, OH 44022
Estimated Value: $573,000 - $734,000
2
Beds
2
Baths
2,030
Sq Ft
$319/Sq Ft
Est. Value
About This Home
This home is located at 71 Maple St, Chagrin Falls, OH 44022 and is currently estimated at $648,281, approximately $319 per square foot. 71 Maple St is a home located in Cuyahoga County with nearby schools including Gurney Elementary School, Chagrin Falls Intermediate Elementary School, and Chagrin Falls Middle School.
Ownership History
Date
Name
Owned For
Owner Type
Purchase Details
Closed on
May 14, 2025
Sold by
Kopachy James G and Kopachy Phyllis A
Bought by
Coyne James and Coyne Susan
Current Estimated Value
Purchase Details
Closed on
May 12, 1988
Sold by
Johnson Joseph P
Bought by
Kopachy James G
Purchase Details
Closed on
Jun 8, 1984
Sold by
Pinkett Richard G and Pinkett Loretta
Bought by
Johnson Joseph P
Purchase Details
Closed on
Jan 1, 1975
Bought by
Pinkett Richard G and Pinkett Loretta
Create a Home Valuation Report for This Property
The Home Valuation Report is an in-depth analysis detailing your home's value as well as a comparison with similar homes in the area
Home Values in the Area
Average Home Value in this Area
Purchase History
| Date | Buyer | Sale Price | Title Company |
|---|---|---|---|
| Coyne James | $570,000 | Title Professionals | |
| Kopachy James G | $147,900 | -- | |
| Johnson Joseph P | $118,600 | -- | |
| Pinkett Richard G | -- | -- |
Source: Public Records
Tax History
| Year | Tax Paid | Tax Assessment Tax Assessment Total Assessment is a certain percentage of the fair market value that is determined by local assessors to be the total taxable value of land and additions on the property. | Land | Improvement |
|---|---|---|---|---|
| 2024 | $12,517 | $203,000 | $45,675 | $157,325 |
| 2023 | $11,507 | $161,670 | $60,870 | $100,800 |
| 2022 | $12,171 | $161,670 | $60,870 | $100,800 |
| 2021 | $12,119 | $161,670 | $60,870 | $100,800 |
| 2020 | $10,504 | $129,330 | $48,690 | $80,640 |
| 2019 | $10,345 | $369,500 | $139,100 | $230,400 |
| 2018 | $10,287 | $129,330 | $48,690 | $80,640 |
| 2017 | $9,140 | $108,720 | $36,720 | $72,000 |
| 2016 | $8,206 | $108,720 | $36,720 | $72,000 |
| 2015 | $7,593 | $108,720 | $36,720 | $72,000 |
| 2014 | $7,593 | $98,840 | $33,390 | $65,450 |
Source: Public Records
Map
Nearby Homes
- 45 Walnut St
- 156 S Franklin St
- 106 W Washington St
- 207 S Main St
- 213 S Main St
- 219 S Main St
- 225 S Main St
- 288 Miles Rd
- 110 Emilia Ct
- 318 Hillside Ln
- 270 Chagrin Blvd
- 6000 Nob Hill Dr Unit F113
- 117 E Cottage St
- 190 Columbus St
- 117 Cleveland St
- 5011 Nob Hill Dr Unit 11C
- S/L Rocker Ave
- 16690 Dayton St
- 7202 Woodland Ave
- 16788 Geneva St
Your Personal Tour Guide
Ask me questions while you tour the home.