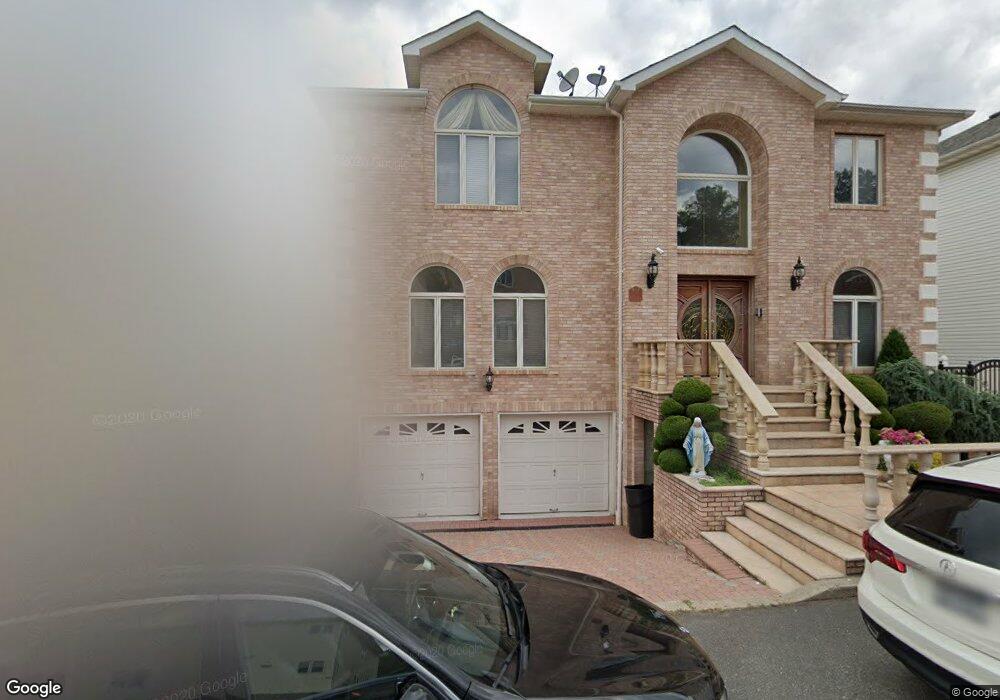
71 Nicole Loop Staten Island, NY 10301
Emerson Hill NeighborhoodEstimated Value: $952,000 - $1,550,000
3
Beds
4
Baths
3,300
Sq Ft
$373/Sq Ft
Est. Value
About This Home
This home is located at 71 Nicole Loop, Staten Island, NY 10301 and is currently estimated at $1,230,717, approximately $372 per square foot. 71 Nicole Loop is a home located in Richmond County with nearby schools including P.S. 48 - William C. Wilcox, I.S. 49 Berta A Dreyfus, and New Dorp High School.
Ownership History
Date
Name
Owned For
Owner Type
Purchase Details
Closed on
Aug 18, 2017
Sold by
Sterling Zachary D and Sterling Irina
Bought by
Huang Jin Gang and Lo Vanessa A
Current Estimated Value
Home Financials for this Owner
Home Financials are based on the most recent Mortgage that was taken out on this home.
Original Mortgage
$884,800
Outstanding Balance
$738,297
Interest Rate
3.96%
Mortgage Type
New Conventional
Estimated Equity
$492,420
Purchase Details
Closed on
May 7, 2014
Sold by
Krigsman Osip and Krigsman Rima
Bought by
Sterling Zachary D and Sterling Irina
Home Financials for this Owner
Home Financials are based on the most recent Mortgage that was taken out on this home.
Original Mortgage
$668,000
Interest Rate
4.33%
Mortgage Type
New Conventional
Purchase Details
Closed on
Nov 5, 1998
Sold by
Sivergate At Emerson Llc
Bought by
Krigsman Osip and Krigsman Rima
Create a Home Valuation Report for This Property
The Home Valuation Report is an in-depth analysis detailing your home's value as well as a comparison with similar homes in the area
Home Values in the Area
Average Home Value in this Area
Purchase History
| Date | Buyer | Sale Price | Title Company |
|---|---|---|---|
| Huang Jin Gang | $1,106,000 | First American Title Insuran | |
| Sterling Zachary D | $835,000 | Evident Title Agency | |
| Krigsman Osip | $185,000 | -- |
Source: Public Records
Mortgage History
| Date | Status | Borrower | Loan Amount |
|---|---|---|---|
| Open | Huang Jin Gang | $884,800 | |
| Previous Owner | Sterling Zachary D | $668,000 |
Source: Public Records
Tax History
| Year | Tax Paid | Tax Assessment Tax Assessment Total Assessment is a certain percentage of the fair market value that is determined by local assessors to be the total taxable value of land and additions on the property. | Land | Improvement |
|---|---|---|---|---|
| 2025 | $9,142 | $62,940 | $7,635 | $55,305 |
| 2024 | $9,142 | $63,900 | $7,095 | $56,805 |
| 2023 | $8,721 | $42,941 | $6,874 | $36,067 |
| 2022 | $8,572 | $54,060 | $9,960 | $44,100 |
| 2021 | $8,969 | $57,000 | $9,960 | $47,040 |
| 2020 | $8,510 | $63,000 | $9,960 | $53,040 |
| 2019 | $7,935 | $63,180 | $9,960 | $53,220 |
| 2018 | $7,295 | $35,784 | $6,796 | $28,988 |
| 2017 | $7,295 | $35,784 | $6,528 | $29,256 |
| 2016 | $7,100 | $35,515 | $6,815 | $28,700 |
| 2015 | $6,066 | $33,505 | $6,467 | $27,038 |
| 2014 | $6,066 | $31,609 | $7,319 | $24,290 |
Source: Public Records
Map
Nearby Homes
- 55 Nicole Loop
- 16 Diana Trail
- 79 Endor Ave
- 201 Milford Ave
- 35 Milden Ave
- 74 Longfellow Ave
- 260 Douglas Rd
- 47 Longfellow Ave
- 197 Seneca Ave
- 86 Tioga St
- 174 Douglas Rd
- 25 Beebe St
- 159 Seneca Ave
- 1430 Clove Rd
- 830 Howard Ave Unit 3A
- 830 Howard Ave Unit 4H
- 830 Howard Ave Unit 3H
- 755 Narrows Rd N Unit 602
- 755 Narrows Rd N Unit 513A
- 755 Narrows Rd N Unit 305
- 75 Nicole Loop
- 67 Nicole Loop
- 74 Michael Loop
- 78 Michael Loop
- 79 Nicole Loop
- 63 Nicole Loop
- 70 Michael Loop
- 72 Nicole Loop
- 68 Nicole Loop
- 76 Nicole Loop
- 66 Michael Loop
- 83 Nicole Loop
- 59 Nicole Loop
- 64 Nicole Loop
- 82 Michael Loop
- 80 Nicole Loop
- 62 Michael Loop
- 22 Nicole Loop
- 26 Nicole Loop
- 73 Michael Loop
Your Personal Tour Guide
Ask me questions while you tour the home.