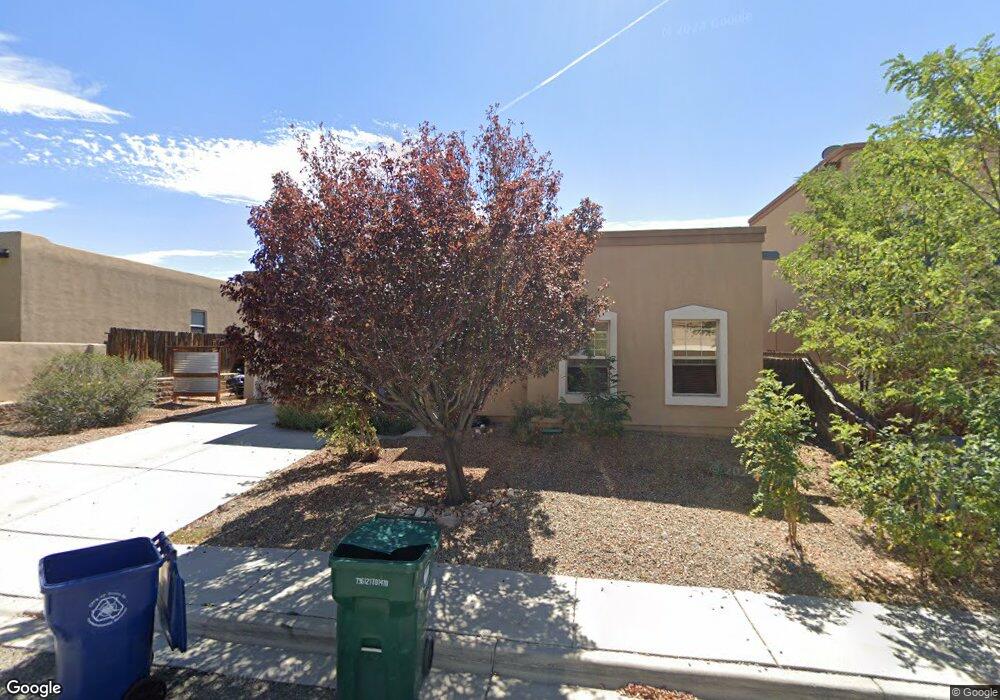
7105 Calientito Loop Santa Fe, NM 87507
Tierra Contenta NeighborhoodEstimated Value: $392,000 - $514,000
3
Beds
2
Baths
1,243
Sq Ft
$359/Sq Ft
Est. Value
About This Home
This home is located at 7105 Calientito Loop, Santa Fe, NM 87507 and is currently estimated at $445,972, approximately $358 per square foot. 7105 Calientito Loop is a home located in Santa Fe County with nearby schools including Nina Otero Community School, Capital High School, and New Mexico Connections Academy.
Ownership History
Date
Name
Owned For
Owner Type
Purchase Details
Closed on
Aug 9, 2019
Sold by
Napiorkowski Krysia
Bought by
Whittaker Yancy L
Current Estimated Value
Home Financials for this Owner
Home Financials are based on the most recent Mortgage that was taken out on this home.
Original Mortgage
$285,000
Outstanding Balance
$249,045
Interest Rate
3.8%
Mortgage Type
VA
Estimated Equity
$196,927
Purchase Details
Closed on
Oct 30, 2017
Sold by
Dryer Kathleen
Bought by
Napiorkowski Krysia
Purchase Details
Closed on
Feb 7, 2007
Sold by
Bt Homes Inc
Bought by
Dryer Kathleen
Home Financials for this Owner
Home Financials are based on the most recent Mortgage that was taken out on this home.
Original Mortgage
$178,000
Interest Rate
6.19%
Mortgage Type
Purchase Money Mortgage
Create a Home Valuation Report for This Property
The Home Valuation Report is an in-depth analysis detailing your home's value as well as a comparison with similar homes in the area
Home Values in the Area
Average Home Value in this Area
Purchase History
| Date | Buyer | Sale Price | Title Company |
|---|---|---|---|
| Whittaker Yancy L | -- | First American Title Ins Co | |
| Napiorkowski Krysia | -- | Prima Title Llc | |
| Dryer Kathleen | -- | Landamerica Capitol City Tit |
Source: Public Records
Mortgage History
| Date | Status | Borrower | Loan Amount |
|---|---|---|---|
| Open | Whittaker Yancy L | $285,000 | |
| Previous Owner | Dryer Kathleen | $178,000 |
Source: Public Records
Tax History
| Year | Tax Paid | Tax Assessment Tax Assessment Total Assessment is a certain percentage of the fair market value that is determined by local assessors to be the total taxable value of land and additions on the property. | Land | Improvement |
|---|---|---|---|---|
| 2025 | $2,273 | $329,441 | $80,505 | $248,936 |
| 2024 | $2,346 | $319,847 | $78,161 | $241,686 |
| 2023 | $2,343 | $310,532 | $75,885 | $234,647 |
| 2022 | $2,289 | $301,488 | $73,675 | $227,813 |
| 2021 | $2,250 | $97,569 | $23,843 | $73,726 |
| 2020 | $2,276 | $94,728 | $20,231 | $74,497 |
| 2019 | $1,947 | $81,776 | $18,883 | $62,893 |
| 2018 | $1,903 | $79,395 | $18,333 | $61,062 |
| 2017 | $1,543 | $62,504 | $18,333 | $44,171 |
| 2016 | $1,455 | $60,683 | $18,333 | $42,350 |
| 2015 | $1,421 | $58,916 | $18,333 | $40,583 |
| 2014 | $1,336 | $57,143 | $18,315 | $38,828 |
Source: Public Records
Map
Nearby Homes
- 4532 Solecito Loop
- 7000 Camino Rojo
- 4609 Contenta Ridge
- 4548 Contenta Ridge
- 4725 Sundial Way
- 7628 Mesa Del Oro Ln
- 7100 Mesa Del Oro
- 7618 Mesa Del Oro Ln
- 7312 Contenta Ridge
- 7324 Contenta Ridge
- 7340 Contenta Ridge
- 7352 Contenta Ridge
- 7223 Via Verde
- 4644 Callejon Lechuza
- 7388 Contenta Ridge
- 4208 Coyote Ln
- 7487 Sagebrush Rd
- 6808 Sunset Cir
- 7496 Sagebrush Rd
- 7485 Saratoga Ln
- 7101 Calientito Loop
- 7109 Calientito Loop
- 7113 Calientito Loop
- 7056 Camino Rojo
- 7104 Calientito Loop
- 7100 Calientito Loop
- 4603 Solecito Loop
- 7108 Calientito Loop
- 4552 Solecito Loop
- 7117 Calientito Loop
- 4556 Solecito Loop
- 7054 Camino Rojo
- 4548 Solecito Loop
- 4548 Solecito Loop Unit (UnitID 12140546)
- 7116 Plaza Central
- 4607 Solecito Loop
- 7112 Calientito Loop
- 4544 Solecito Loop
- 4537 Solecito Loop
- 7112 Plaza Central
Your Personal Tour Guide
Ask me questions while you tour the home.