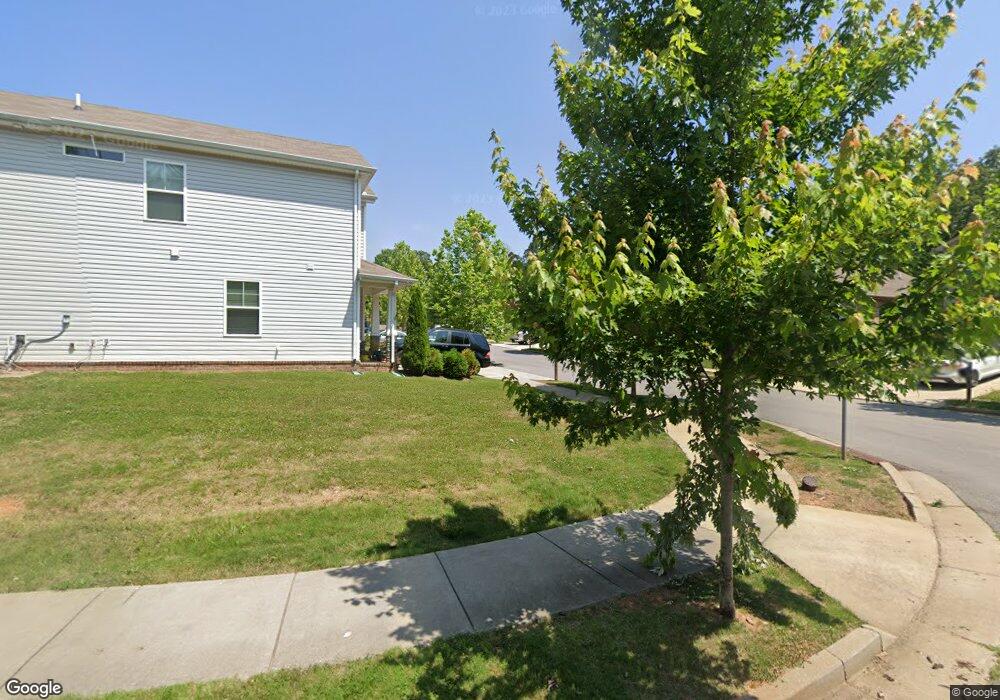
7110 Colquitt Way Unit 86 Fairview, TN 37062
Estimated Value: $431,000 - $469,322
--
Bed
3
Baths
1,722
Sq Ft
$264/Sq Ft
Est. Value
About This Home
This home is located at 7110 Colquitt Way Unit 86, Fairview, TN 37062 and is currently estimated at $455,331, approximately $264 per square foot. 7110 Colquitt Way Unit 86 is a home located in Williamson County with nearby schools including Westwood Elementary School, Fairview Middle School, and Fairview High School.
Ownership History
Date
Name
Owned For
Owner Type
Purchase Details
Closed on
Nov 3, 2021
Sold by
Opendoor Property Trust I
Bought by
Sfr Jv 2 Property Llc
Current Estimated Value
Purchase Details
Closed on
Sep 24, 2021
Sold by
Reyes Joshua W and Reyes Tori L
Bought by
Opendoor Property Trust
Purchase Details
Closed on
Sep 7, 2017
Sold by
Ole South Properties Inc
Bought by
Reyes Joshua W and Reyes Tori L
Home Financials for this Owner
Home Financials are based on the most recent Mortgage that was taken out on this home.
Original Mortgage
$225,823
Interest Rate
4.4%
Mortgage Type
FHA
Purchase Details
Closed on
Aug 8, 2017
Sold by
Ole South Holdings Inc
Bought by
Ole South Properties Inc
Home Financials for this Owner
Home Financials are based on the most recent Mortgage that was taken out on this home.
Original Mortgage
$225,823
Interest Rate
4.4%
Mortgage Type
FHA
Create a Home Valuation Report for This Property
The Home Valuation Report is an in-depth analysis detailing your home's value as well as a comparison with similar homes in the area
Home Values in the Area
Average Home Value in this Area
Purchase History
| Date | Buyer | Sale Price | Title Company |
|---|---|---|---|
| Sfr Jv 2 Property Llc | $410,000 | Os National Llc | |
| Opendoor Property Trust | $367,300 | Os National Llc | |
| Opendoor Property Trust | $367,300 | None Listed On Document | |
| Reyes Joshua W | $229,990 | None Available | |
| Ole South Properties Inc | -- | Tri Star Title & Escrow Llc |
Source: Public Records
Mortgage History
| Date | Status | Borrower | Loan Amount |
|---|---|---|---|
| Previous Owner | Reyes Joshua W | $225,823 |
Source: Public Records
Tax History Compared to Growth
Tax History
| Year | Tax Paid | Tax Assessment Tax Assessment Total Assessment is a certain percentage of the fair market value that is determined by local assessors to be the total taxable value of land and additions on the property. | Land | Improvement |
|---|---|---|---|---|
| 2025 | $1,997 | $98,700 | $28,750 | $69,950 |
| 2024 | $1,997 | $72,450 | $18,125 | $54,325 |
| 2023 | $1,997 | $72,450 | $18,125 | $54,325 |
| 2022 | $1,997 | $72,450 | $18,125 | $54,325 |
| 2021 | $1,362 | $72,450 | $18,125 | $54,325 |
| 2020 | $1,130 | $50,900 | $7,500 | $43,400 |
| 2019 | $1,130 | $50,900 | $7,500 | $43,400 |
| 2018 | $1,094 | $50,900 | $7,500 | $43,400 |
| 2017 | $160 | $50,900 | $7,500 | $43,400 |
| 2016 | $0 | $0 | $0 | $0 |
Source: Public Records
Map
Nearby Homes
- 7087 Wiley Cir
- 7091 Wiley Cir
- 7095 Wiley Cir
- 7099 Wiley Cir
- 7103 Wiley Cir
- 7107 Wiley Cir
- 7247 Cox Pike
- 7113 Cedarcrest Ln
- Opal Plan at Cedarcrest Townhomes
- Anderson Plan at Cedarcrest Townhomes
- 7129 Cedarcrest Ln
- 7137 Cedarcrest Ln
- 7133 Cedarcrest Ln
- 7145 Cedarcrest Ln
- 7149 Cedarcrest Ln
- 7153 Cedarcrest Ln
- 7157 Cedarcrest Ln
- 7161 Cedarcrest Ln
- 7111 Harrison Dr
- 7159 Cedarcrest Ln
- 7110 Colquitt Way
- 7108 Colquitt Way Unit 87
- 7108 Colquitt Way
- 7112 Colquitt Way Unit 85
- 7112 Colquitt Way
- 7106 Colquitt Way Unit 88
- 7106 Colquitt Way
- 7114 Colquitt Way Unit 84
- 7114 Colquitt Way
- 7114 Colquitt Way
- 7107 Colquitt Way Unit 78
- 7107 Colquitt Way
- 7104 Colquitt Way Unit 89
- 7104 Colquitt Way
- 7109 Colquitt Way Unit 79
- 7109 Colquitt Way
- 7111 Colquitt Way Unit 80
- 7111 Colquitt Way
- 7116 Colquitt Way
- 7116 Colquitt Way Unit 83