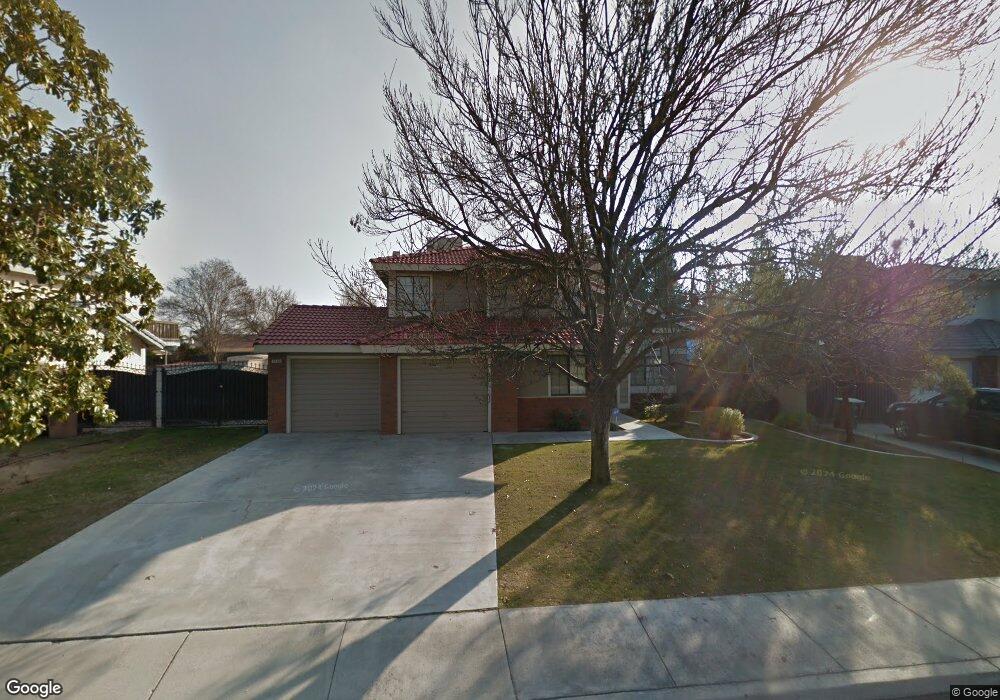
7125 Yuma Way Unit B Bakersfield, CA 93308
Fruitvale NeighborhoodEstimated Value: $467,112 - $502,000
3
Beds
3
Baths
1,244
Sq Ft
$392/Sq Ft
Est. Value
About This Home
This home is located at 7125 Yuma Way Unit B, Bakersfield, CA 93308 and is currently estimated at $487,778, approximately $392 per square foot. 7125 Yuma Way Unit B is a home located in Kern County with nearby schools including Discovery Elementary School, Centennial High School, and Olive Knolls Christian.
Ownership History
Date
Name
Owned For
Owner Type
Purchase Details
Closed on
Jul 31, 2013
Sold by
Boorsma Dale and Boorsma Phyllis
Bought by
Boorsma Dale A and Boorsma Phyllis A
Current Estimated Value
Purchase Details
Closed on
May 29, 1996
Sold by
Relocation Closing Services Inc
Bought by
Boorsma Dale and Boorsma Phyllis
Home Financials for this Owner
Home Financials are based on the most recent Mortgage that was taken out on this home.
Original Mortgage
$60,000
Interest Rate
8.01%
Purchase Details
Closed on
May 16, 1996
Sold by
Lemke Fredrick E and Lemke Zianne A
Bought by
Relocation Closing Services Inc
Home Financials for this Owner
Home Financials are based on the most recent Mortgage that was taken out on this home.
Original Mortgage
$60,000
Interest Rate
8.01%
Purchase Details
Closed on
Dec 22, 1994
Sold by
Kiven Charles W and Kiven Kathleen M
Bought by
Lemke Fredrick E and Lemke Zianne A
Home Financials for this Owner
Home Financials are based on the most recent Mortgage that was taken out on this home.
Original Mortgage
$137,000
Interest Rate
8.43%
Create a Home Valuation Report for This Property
The Home Valuation Report is an in-depth analysis detailing your home's value as well as a comparison with similar homes in the area
Home Values in the Area
Average Home Value in this Area
Purchase History
| Date | Buyer | Sale Price | Title Company |
|---|---|---|---|
| Boorsma Dale A | -- | None Available | |
| Boorsma Dale | $147,500 | Fidelity National Title | |
| Relocation Closing Services Inc | -- | Fidelity National Title | |
| Lemke Fredrick E | $155,000 | First American Title Co |
Source: Public Records
Mortgage History
| Date | Status | Borrower | Loan Amount |
|---|---|---|---|
| Closed | Boorsma Dale | $60,000 | |
| Previous Owner | Lemke Fredrick E | $137,000 |
Source: Public Records
Tax History Compared to Growth
Tax History
| Year | Tax Paid | Tax Assessment Tax Assessment Total Assessment is a certain percentage of the fair market value that is determined by local assessors to be the total taxable value of land and additions on the property. | Land | Improvement |
|---|---|---|---|---|
| 2025 | $3,494 | $245,004 | $51,482 | $193,522 |
| 2024 | $3,494 | $240,201 | $50,473 | $189,728 |
| 2023 | $3,430 | $235,492 | $49,484 | $186,008 |
| 2022 | $3,371 | $230,875 | $48,514 | $182,361 |
| 2021 | $3,256 | $226,349 | $47,563 | $178,786 |
| 2020 | $3,234 | $224,029 | $47,076 | $176,953 |
| 2019 | $3,108 | $224,029 | $47,076 | $176,953 |
| 2018 | $3,113 | $215,332 | $45,249 | $170,083 |
| 2017 | $3,039 | $211,111 | $44,362 | $166,749 |
| 2016 | $2,840 | $206,973 | $43,493 | $163,480 |
| 2015 | $2,812 | $203,865 | $42,840 | $161,025 |
| 2014 | $2,752 | $199,872 | $42,001 | $157,871 |
Source: Public Records
Map
Nearby Homes
- 7113 Aztec Way
- 7101 Aztec Way
- 7209 Copper Creek Way
- 7015 Topaz Ln
- 7112 Brookshire Ave
- 7001 Eloy Ave
- 5100 Ruth Ct
- 7421 Feather River Dr
- 7601 Live Oak Way
- 5306 Deville Ct
- 6701 Hooper Ave
- 7625 Weldon Ave
- 4370 Fruitvale Ave
- 7357 Hooper Ave
- 5216 Westpark St
- 7417 Maleta Ct
- 6301 Spring Valley Dr
- 7700 Peanut Ave
- 5433 Westpark St
- 4906 Palisades Cir
- 7121 Yuma Way
- 7129 Yuma Way
- 7124 Bandolero Way
- 7117 Yuma Way
- 7120 Bandolero Way
- 7128 Bandolero Way Unit A
- 7124 Yuma Way
- 7116 Bandolero Way Unit A
- 7120 Yuma Way
- 7128 Yuma Way
- 7201 Yuma Way
- 7113 Yuma Way Unit B
- 7116 Yuma Way
- 7132 Yuma Way
- 7200 Bandolero Way
- 7112 Bandolero Way
- 7112 Yuma Way
- 7205 Yuma Way
- 7109 Yuma Way
- 7200 Yuma Way