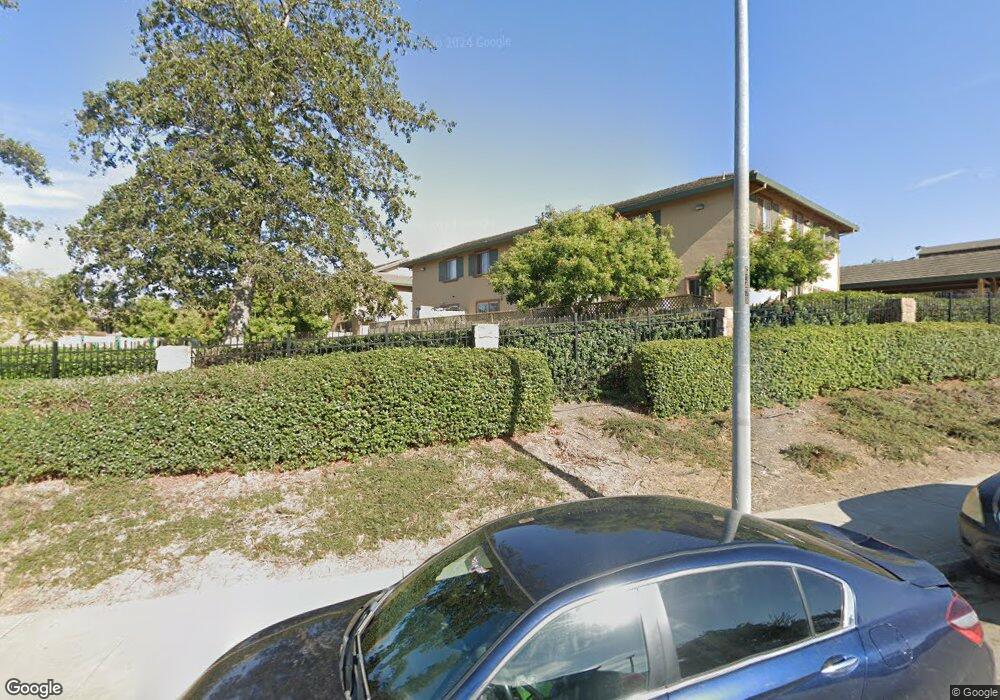
713 Garner Ave Unit 101 Salinas, CA 93905
East Salinas NeighborhoodEstimated Value: $357,481 - $413,000
3
Beds
1
Bath
988
Sq Ft
$383/Sq Ft
Est. Value
About This Home
This home is located at 713 Garner Ave Unit 101, Salinas, CA 93905 and is currently estimated at $378,120, approximately $382 per square foot. 713 Garner Ave Unit 101 is a home located in Monterey County with nearby schools including Virginia Rocca Barton Elementary School, La Paz Middle School, and Alisal High School.
Ownership History
Date
Name
Owned For
Owner Type
Purchase Details
Closed on
Dec 8, 2008
Sold by
Wachovia Mortgage Fsb
Bought by
Verona Gardens Llc
Current Estimated Value
Purchase Details
Closed on
Sep 10, 2008
Sold by
Ortiz Marisa
Bought by
Wachovia Mortgage Fsb
Purchase Details
Closed on
Nov 1, 2004
Sold by
Marcy Ramon David and Marcy Ramon
Bought by
Ortiz Marisa
Home Financials for this Owner
Home Financials are based on the most recent Mortgage that was taken out on this home.
Original Mortgage
$252,000
Interest Rate
1%
Mortgage Type
New Conventional
Purchase Details
Closed on
May 27, 2004
Sold by
Twin Creeks Development Inc
Bought by
Marcy Ramon David and Marcy Ramon
Home Financials for this Owner
Home Financials are based on the most recent Mortgage that was taken out on this home.
Original Mortgage
$194,320
Interest Rate
5.5%
Mortgage Type
Unknown
Create a Home Valuation Report for This Property
The Home Valuation Report is an in-depth analysis detailing your home's value as well as a comparison with similar homes in the area
Home Values in the Area
Average Home Value in this Area
Purchase History
| Date | Buyer | Sale Price | Title Company |
|---|---|---|---|
| Verona Gardens Llc | $78,500 | Chicago Title Company | |
| Wachovia Mortgage Fsb | $81,180 | Chicago Title Insurance Co | |
| Ortiz Marisa | $315,000 | Old Republic Title | |
| Marcy Ramon David | $243,000 | Chicago Title |
Source: Public Records
Mortgage History
| Date | Status | Borrower | Loan Amount |
|---|---|---|---|
| Previous Owner | Ortiz Marisa | $252,000 | |
| Previous Owner | Marcy Ramon David | $194,320 | |
| Closed | Ortiz Marisa | $31,500 |
Source: Public Records
Tax History Compared to Growth
Tax History
| Year | Tax Paid | Tax Assessment Tax Assessment Total Assessment is a certain percentage of the fair market value that is determined by local assessors to be the total taxable value of land and additions on the property. | Land | Improvement |
|---|---|---|---|---|
| 2025 | $1,366 | $101,070 | $38,623 | $62,447 |
| 2024 | $1,366 | $99,089 | $37,866 | $61,223 |
| 2023 | $1,341 | $97,147 | $37,124 | $60,023 |
| 2022 | $1,208 | $95,244 | $36,397 | $58,847 |
| 2021 | $1,207 | $93,378 | $35,684 | $57,694 |
| 2020 | $1,194 | $92,422 | $35,319 | $57,103 |
| 2019 | $1,230 | $90,611 | $34,627 | $55,984 |
| 2018 | $1,158 | $88,836 | $33,949 | $54,887 |
| 2017 | $1,201 | $87,095 | $33,284 | $53,811 |
| 2016 | $1,141 | $85,388 | $32,632 | $52,756 |
| 2015 | $1,131 | $84,106 | $32,142 | $51,964 |
| 2014 | $1,091 | $82,460 | $31,513 | $50,947 |
Source: Public Records
Map
Nearby Homes
- 704 Garner Ave Unit 3
- 709 Gee St
- 742 Pino Way
- 914 Acosta Plaza Unit 91
- 914 Acosta Plaza Unit 111
- 914 Acosta Plaza Unit 94
- 917 Acosta Plaza Unit 4
- 916 Acosta Plaza Unit 15
- 916 Acosta Plaza Unit 23
- 918 Acosta Plaza Unit 55
- 1049 Twin Creeks Dr
- 811 Kilbreth Ave
- 11 Hill Cir
- 1513 Oyster Bay Ct
- 840 N Madeira Ave
- 544 Saint George Dr
- 852 Antigua Ave
- 1615 Newport Ct
- 822 Castleton St
- 18 Suffield Cir
- 713 Garner Ave Unit 102
- 713 Garner Ave Unit 204
- 713 Garner Ave Unit 101
- 713 Garner Ave Unit 104
- 713 Garner Ave Unit 202
- 713 Garner Ave Unit 204
- 713 Garner Ave Unit 203
- 713 Garner Ave Unit 201
- 713 Garner Ave Unit 103
- 1111 Alamo Way
- 715 Garner Ave Unit 102
- 715 Garner Ave Unit 202
- 715 Garner Ave Unit 104
- 715 Garner Ave Unit 204
- 715 Garner Ave Unit 203
- 715 Garner Ave Unit 201
- 715 Garner Ave Unit 103
- 715 Garner Ave Unit 102
- 717 Garner Ave Unit 103
- 717 Garner Ave Unit 102