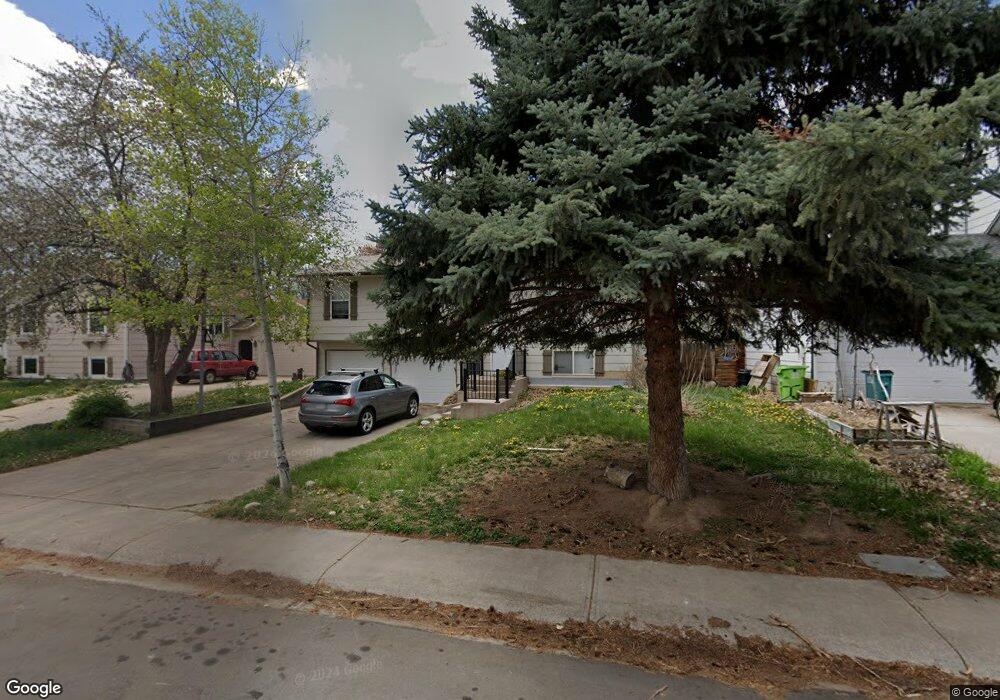
713 Pear St Fort Collins, CO 80521
Rogers Park NeighborhoodEstimated Value: $485,000 - $528,000
4
Beds
2
Baths
1,532
Sq Ft
$336/Sq Ft
Est. Value
About This Home
This home is located at 713 Pear St, Fort Collins, CO 80521 and is currently estimated at $515,153, approximately $336 per square foot. 713 Pear St is a home located in Larimer County with nearby schools including Bauder Elementary School, Lincoln Middle School, and Poudre High School.
Ownership History
Date
Name
Owned For
Owner Type
Purchase Details
Closed on
Aug 20, 2021
Sold by
Ftc Homes Llc
Bought by
Pear 713 Llc
Current Estimated Value
Purchase Details
Closed on
Nov 7, 2014
Sold by
Holt Daniel W
Bought by
Ftc Homes Llc
Purchase Details
Closed on
Jul 20, 1998
Sold by
Shannon Michael A
Bought by
Holt Daniel W
Purchase Details
Closed on
Apr 1, 1996
Sold by
Group Inc
Bought by
Shannon Michael A
Purchase Details
Closed on
Mar 1, 1996
Sold by
Tegtmeier Rodney W
Bought by
Group Inc Real Estate Associates
Purchase Details
Closed on
Jun 1, 1993
Sold by
Group Inc Real Estate Associates
Bought by
Tegtmeier Rodney W
Create a Home Valuation Report for This Property
The Home Valuation Report is an in-depth analysis detailing your home's value as well as a comparison with similar homes in the area
Home Values in the Area
Average Home Value in this Area
Purchase History
| Date | Buyer | Sale Price | Title Company |
|---|---|---|---|
| Pear 713 Llc | $385,000 | Guaranteed Title Group Llc | |
| Ftc Homes Llc | -- | None Available | |
| Holt Daniel W | -- | -- | |
| Shannon Michael A | $121,000 | -- | |
| Group Inc Real Estate Associates | $111,400 | -- | |
| Tegtmeier Rodney W | $86,000 | -- |
Source: Public Records
Tax History Compared to Growth
Tax History
| Year | Tax Paid | Tax Assessment Tax Assessment Total Assessment is a certain percentage of the fair market value that is determined by local assessors to be the total taxable value of land and additions on the property. | Land | Improvement |
|---|---|---|---|---|
| 2025 | $2,973 | $34,666 | $2,680 | $31,986 |
| 2024 | $2,828 | $34,666 | $2,680 | $31,986 |
| 2022 | $2,131 | $22,567 | $2,780 | $19,787 |
| 2021 | $2,153 | $23,216 | $2,860 | $20,356 |
| 2020 | $2,077 | $22,201 | $2,860 | $19,341 |
| 2019 | $2,086 | $22,201 | $2,860 | $19,341 |
| 2018 | $1,512 | $16,589 | $2,880 | $13,709 |
| 2017 | $1,507 | $16,589 | $2,880 | $13,709 |
| 2016 | $1,434 | $13,588 | $3,184 | $10,404 |
| 2015 | $1,232 | $13,580 | $3,180 | $10,400 |
| 2014 | $1,075 | $11,780 | $3,180 | $8,600 |
Source: Public Records
Map
Nearby Homes
- 2519 Timber Ct
- 813 Timber Ln
- 812 Rocky Rd
- 805 Gallup Rd
- 812 Gallup Rd
- 2609 Bartlett Dr
- 2436 Poplar Dr
- 2914 Orchard Place
- 2942 Orchard Place
- 2815 Orchard Place
- 2913 Orchard Place
- 2809 Orchard Place
- 2895 Orchard Place
- 501 Locust Grove Dr
- 1002 Andrews Peak Dr Unit 103
- 1014 Andrews Peak Dr Unit D112
- 1037 Cypress Dr
- 720 S Overland Trail
- 850 S Overland Trail Unit 20
- 2211 W Mulberry St Unit 106