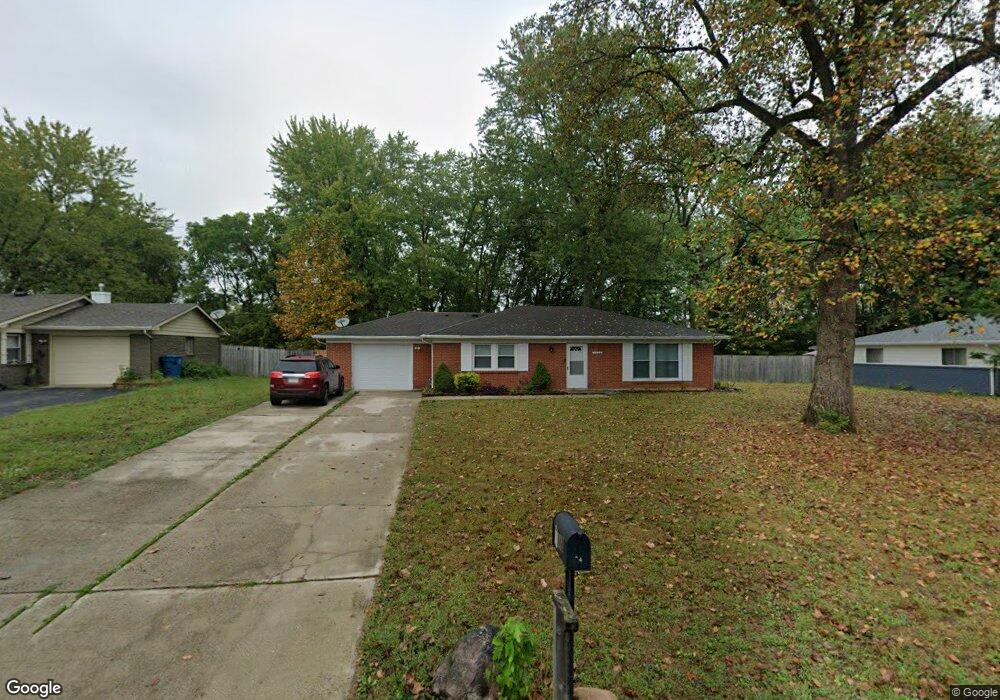
7142 Doris Dr Indianapolis, IN 46214
Chapel Hill-Ben Davis NeighborhoodEstimated Value: $205,000 - $218,000
4
Beds
2
Baths
1,230
Sq Ft
$172/Sq Ft
Est. Value
About This Home
This home is located at 7142 Doris Dr, Indianapolis, IN 46214 and is currently estimated at $211,373, approximately $171 per square foot. 7142 Doris Dr is a home located in Marion County with nearby schools including Chapelwood Elementary School, Chapel Hill 7th & 8th Grade Center, and Ben Davis Ninth Grade Center.
Ownership History
Date
Name
Owned For
Owner Type
Purchase Details
Closed on
Mar 19, 2007
Sold by
Moss Adam and Brown Angela
Bought by
Hernnadez Marvin
Current Estimated Value
Home Financials for this Owner
Home Financials are based on the most recent Mortgage that was taken out on this home.
Original Mortgage
$96,000
Outstanding Balance
$58,266
Interest Rate
6.31%
Mortgage Type
New Conventional
Estimated Equity
$153,107
Purchase Details
Closed on
Mar 2, 2006
Sold by
Jackson Alphonsco and Secretary Of Hud
Bought by
Moss Adam and Brown Angelia
Home Financials for this Owner
Home Financials are based on the most recent Mortgage that was taken out on this home.
Original Mortgage
$70,000
Interest Rate
6.37%
Mortgage Type
Adjustable Rate Mortgage/ARM
Purchase Details
Closed on
Dec 12, 2005
Sold by
National City Bank Of Indiana
Bought by
Secretary Of Hud Of Washington Dc
Purchase Details
Closed on
Nov 28, 2005
Sold by
Burcham Kelly L
Bought by
National City Bank
Purchase Details
Closed on
Nov 5, 2005
Sold by
Jpmorgan Chase Bank
Bought by
Preferred Real Estate Solutions Llc
Create a Home Valuation Report for This Property
The Home Valuation Report is an in-depth analysis detailing your home's value as well as a comparison with similar homes in the area
Home Values in the Area
Average Home Value in this Area
Purchase History
| Date | Buyer | Sale Price | Title Company |
|---|---|---|---|
| Hernnadez Marvin | -- | None Available | |
| Moss Adam | -- | None Available | |
| Secretary Of Hud Of Washington Dc | -- | None Available | |
| National City Bank | $109,294 | None Available | |
| Preferred Real Estate Solutions Llc | -- | None Available |
Source: Public Records
Mortgage History
| Date | Status | Borrower | Loan Amount |
|---|---|---|---|
| Open | Hernnadez Marvin | $96,000 | |
| Previous Owner | Moss Adam | $70,000 |
Source: Public Records
Tax History
| Year | Tax Paid | Tax Assessment Tax Assessment Total Assessment is a certain percentage of the fair market value that is determined by local assessors to be the total taxable value of land and additions on the property. | Land | Improvement |
|---|---|---|---|---|
| 2024 | $3,941 | $166,900 | $14,800 | $152,100 |
| 2023 | $3,941 | $163,200 | $14,800 | $148,400 |
| 2022 | $3,771 | $156,500 | $14,800 | $141,700 |
| 2021 | $3,340 | $120,700 | $14,800 | $105,900 |
| 2020 | $3,359 | $121,500 | $14,800 | $106,700 |
| 2019 | $2,976 | $107,400 | $14,800 | $92,600 |
| 2018 | $2,474 | $101,700 | $14,800 | $86,900 |
| 2017 | $1,118 | $92,800 | $14,800 | $78,000 |
| 2016 | $1,099 | $91,400 | $14,800 | $76,600 |
| 2014 | $756 | $82,500 | $14,800 | $67,700 |
| 2013 | $1,594 | $79,700 | $14,800 | $64,900 |
Source: Public Records
Map
Nearby Homes
- 6913 Thousand Oaks Dr
- 6932 Lohr Way
- 6731 W 16th St
- 1907 Maradona Dr
- 1232 Topp Creek Dr
- 6678 W 14th St
- 6612 W 14th St
- 2104 Napa Cir
- 2326 Gradison Cir
- 2321 Gradison Cir
- 6605 W 12th St
- 6911 W 10th St
- 7835 Inishmore Way
- 7906 Inishmore Dr
- 7206 Halden Place
- 7515 W Saint Clair St
- 7506 Radburn Cir
- 6574 Cahill Place Unit A
- 522 Chapel Hill West Dr
- 5870 Cadillac Dr
- 7150 Doris Dr
- 7134 Doris Dr
- 7202 Doris Dr
- 7126 Doris Dr
- 7143 Doris Dr
- 7149 Doris Dr
- 7135 Doris Dr
- 7210 Doris Dr
- 7118 Doris Dr
- 7133 Thousand Oaks Ln
- 1904 Theodore Dr
- 7127 Doris Dr
- 7207 Doris Dr
- 7127 Thousand Oaks Ln
- 1835 Marsha Dr
- 7117 Doris Dr
- 1809 Marsha Dr
- 7110 Doris Dr
- 1910 Theodore Dr
- 7121 Thousand Oaks Ln