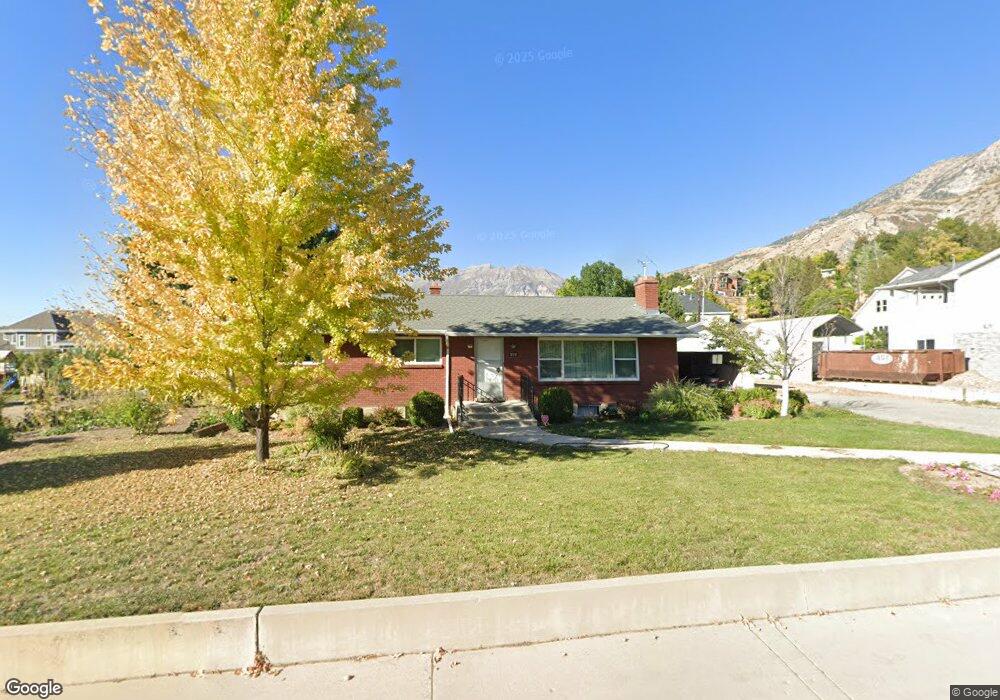
715 E 2950 N Provo, UT 84604
Rock Canyon NeighborhoodEstimated Value: $473,000 - $500,000
2
Beds
1
Bath
1,224
Sq Ft
$401/Sq Ft
Est. Value
About This Home
This home is located at 715 E 2950 N, Provo, UT 84604 and is currently estimated at $490,292, approximately $400 per square foot. 715 E 2950 N is a home located in Utah County with nearby schools including Edgemont School, Centennial Middle School, and Timpview High School.
Ownership History
Date
Name
Owned For
Owner Type
Purchase Details
Closed on
Oct 1, 2024
Sold by
Lela Davis Stott Trust and Morgan Debby
Bought by
Hunter Gregory and Hunter Emilia
Current Estimated Value
Home Financials for this Owner
Home Financials are based on the most recent Mortgage that was taken out on this home.
Original Mortgage
$200,000
Outstanding Balance
$196,964
Interest Rate
6.46%
Mortgage Type
New Conventional
Estimated Equity
$293,328
Purchase Details
Closed on
Nov 21, 2017
Sold by
Stotts Lela Davis
Bought by
Scott Lela Davis and Scott Trustr
Purchase Details
Closed on
Oct 5, 2017
Sold by
Stott Lala Davis
Bought by
Stott Lala Davis and Lela Davis Stott Trust
Purchase Details
Closed on
Jun 18, 2010
Sold by
Stott Lela Davis
Bought by
Stott Lela Davis and The Lela Davis Stott Trust
Purchase Details
Closed on
May 5, 2010
Sold by
Davis Eugene O
Bought by
Davis Wayne B and Stott Lela Davis
Purchase Details
Closed on
Mar 17, 2010
Sold by
Davis Dora Rachel
Bought by
Davis Dora Rachel and Dora Rachel Davis Family Living Trust
Create a Home Valuation Report for This Property
The Home Valuation Report is an in-depth analysis detailing your home's value as well as a comparison with similar homes in the area
Home Values in the Area
Average Home Value in this Area
Purchase History
| Date | Buyer | Sale Price | Title Company |
|---|---|---|---|
| Hunter Gregory | -- | Pro Title & Escrow | |
| Scott Lela Davis | -- | None Available | |
| Stott Lala Davis | -- | None Available | |
| Stott Lela Davis | -- | Accommodation | |
| Stott Lela Davis | -- | Accommodation | |
| Stott Lela Davis | -- | Accommodation | |
| Davis Wayne B | -- | Fidelity Title | |
| Davis Dora Rachel | -- | Fidelity Land & Title |
Source: Public Records
Mortgage History
| Date | Status | Borrower | Loan Amount |
|---|---|---|---|
| Open | Hunter Gregory | $200,000 |
Source: Public Records
Tax History
| Year | Tax Paid | Tax Assessment Tax Assessment Total Assessment is a certain percentage of the fair market value that is determined by local assessors to be the total taxable value of land and additions on the property. | Land | Improvement |
|---|---|---|---|---|
| 2025 | $2,233 | $247,005 | -- | -- |
| 2024 | $2,145 | $219,835 | $0 | $0 |
| 2023 | $2,145 | $208,175 | $0 | $0 |
| 2022 | $2,132 | $208,615 | $0 | $0 |
| 2021 | $1,642 | $280,200 | $184,300 | $95,900 |
| 2020 | $1,548 | $247,600 | $153,600 | $94,000 |
| 2019 | $1,488 | $247,600 | $153,600 | $94,000 |
| 2018 | $1,399 | $236,100 | $142,100 | $94,000 |
| 2017 | $1,335 | $123,750 | $0 | $0 |
| 2016 | $1,258 | $108,735 | $0 | $0 |
| 2015 | $1,152 | $100,595 | $0 | $0 |
| 2014 | $1,014 | $92,290 | $0 | $0 |
Source: Public Records
Map
Nearby Homes
- 758 E 3030 N
- 3129 Cherokee Ln
- 788 E 2680 N
- 2774 N 370 E
- 3250 Mohawk Ln
- 3025 N 250 E
- 1108 E 2620 N
- 5600 N Canyon Rd
- 2735 N Country Club Dr
- 2848 Foothill Dr
- 3221 Shadowbrook Cir
- 3013 N 100 W
- 3057 N 100 W
- 3702 N 920 E
- 3305 N Shadowbrook Cir
- 3711 N Canyon Rd
- 2254 N 390 E
- 111 Candlewood Place
- 2999 N Marrcrest West Dr
- 3240 Shadowbrook Dr
Your Personal Tour Guide
Ask me questions while you tour the home.