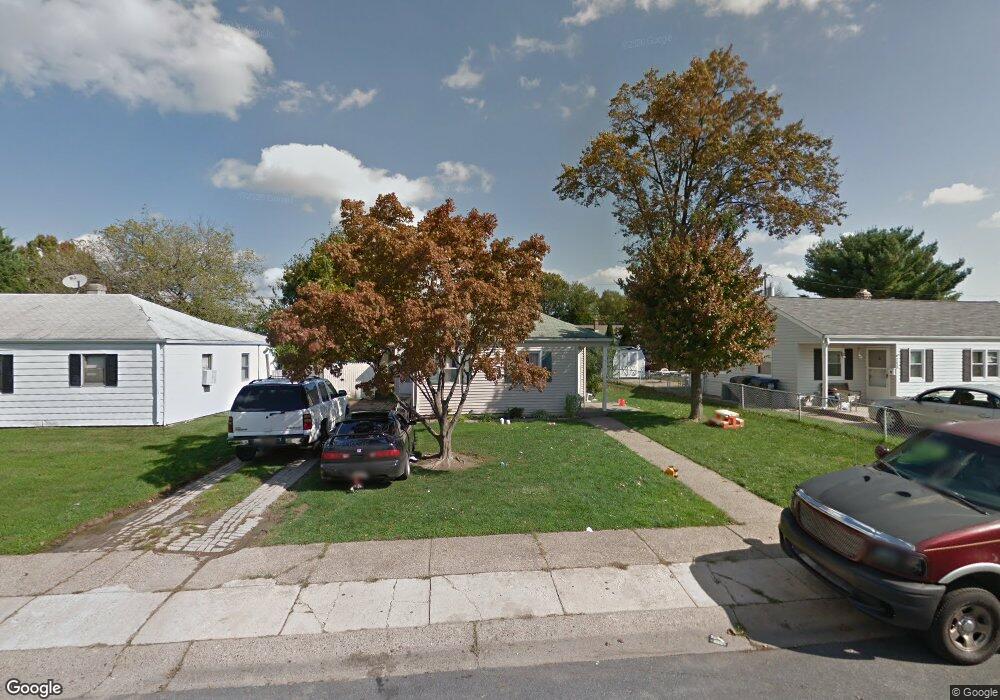
715 Garnet Rd Wilmington, DE 19804
Ashley NeighborhoodEstimated Value: $237,000 - $251,000
3
Beds
1
Bath
1,117
Sq Ft
$221/Sq Ft
Est. Value
About This Home
This home is located at 715 Garnet Rd, Wilmington, DE 19804 and is currently estimated at $246,357, approximately $220 per square foot. 715 Garnet Rd is a home located in New Castle County with nearby schools including Richey Elementary School, Stanton Middle School, and The John Dickinson School.
Ownership History
Date
Name
Owned For
Owner Type
Purchase Details
Closed on
Oct 24, 2022
Sold by
Aguado Jesus
Bought by
Aguado-Garcia J Jesus J and Aguado-Garcia Judith E
Current Estimated Value
Purchase Details
Closed on
Aug 30, 2004
Sold by
Sheiker Bruce
Bought by
Garcia Aguado Jesus and Garcia Aguado Teresa
Home Financials for this Owner
Home Financials are based on the most recent Mortgage that was taken out on this home.
Original Mortgage
$137,738
Interest Rate
6.08%
Mortgage Type
Purchase Money Mortgage
Purchase Details
Closed on
May 6, 2004
Sold by
Barni Kevin W
Bought by
Sheiker Bruce
Purchase Details
Closed on
Sep 24, 2001
Sold by
Barni Blane A and Tyrrell Darlene M
Bought by
Barni Kevin W
Home Financials for this Owner
Home Financials are based on the most recent Mortgage that was taken out on this home.
Original Mortgage
$55,000
Interest Rate
6.91%
Create a Home Valuation Report for This Property
The Home Valuation Report is an in-depth analysis detailing your home's value as well as a comparison with similar homes in the area
Home Values in the Area
Average Home Value in this Area
Purchase History
| Date | Buyer | Sale Price | Title Company |
|---|---|---|---|
| Aguado-Garcia J Jesus J | -- | -- | |
| Garcia Aguado Jesus | $139,900 | -- | |
| Sheiker Bruce | $82,037 | -- | |
| Barni Kevin W | -- | -- |
Source: Public Records
Mortgage History
| Date | Status | Borrower | Loan Amount |
|---|---|---|---|
| Previous Owner | Garcia Aguado Jesus | $137,738 | |
| Previous Owner | Barni Kevin W | $55,000 | |
| Closed | Garcia Aguado Jesus | $4,000 |
Source: Public Records
Tax History Compared to Growth
Tax History
| Year | Tax Paid | Tax Assessment Tax Assessment Total Assessment is a certain percentage of the fair market value that is determined by local assessors to be the total taxable value of land and additions on the property. | Land | Improvement |
|---|---|---|---|---|
| 2024 | $1,472 | $38,800 | $7,300 | $31,500 |
| 2023 | $1,303 | $38,800 | $7,300 | $31,500 |
| 2022 | $1,311 | $38,800 | $7,300 | $31,500 |
| 2021 | $1,310 | $38,800 | $7,300 | $31,500 |
| 2020 | $1,314 | $38,800 | $7,300 | $31,500 |
| 2019 | $1,773 | $38,800 | $7,300 | $31,500 |
| 2018 | $2,407 | $38,800 | $7,300 | $31,500 |
| 2017 | $1,272 | $38,800 | $7,300 | $31,500 |
| 2016 | $1,214 | $38,800 | $7,300 | $31,500 |
| 2015 | $1,338 | $38,800 | $7,300 | $31,500 |
| 2014 | $1,056 | $38,800 | $7,300 | $31,500 |
Source: Public Records
Map
Nearby Homes
- 602 Erdman Rd
- 318 Atkinson Rd
- 516 Becker Ave
- 405 N Augustine St
- 1217 Newport Gap Pike
- 37 Read Ave
- 6 Colefax Ct
- 409 Boxwood Rd
- 203 Latimer St
- 6 Grosvenor Ct Unit 14
- 0 Kiamensi Rd
- 104 Laurel Ln
- 208 Harding Ave
- 0 Exmore Ave
- 0 Central Ave
- 3419 LOT 3 Old Capitol Trail
- 3419 LOT 2 Old Capitol Trail
- 3419 LOT 4 Old Capitol Trail
- 116 Brookside Ave
- 444 Forest Dr