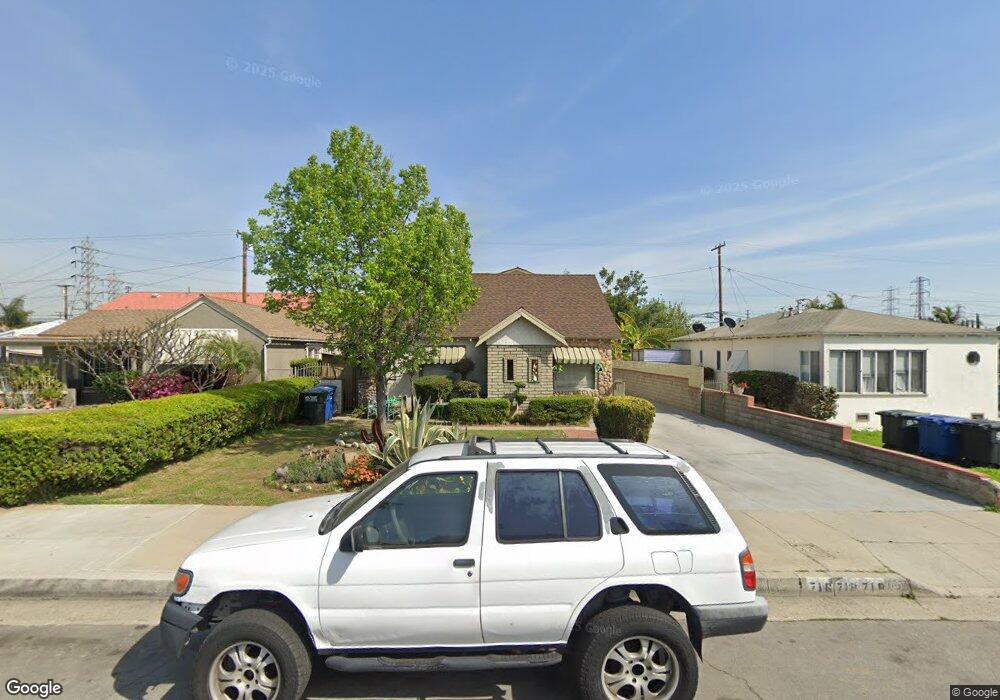
716 Findlay Ave Los Angeles, CA 90022
Estimated Value: $718,000 - $779,000
4
Beds
3
Baths
2,076
Sq Ft
$363/Sq Ft
Est. Value
About This Home
This home is located at 716 Findlay Ave, Los Angeles, CA 90022 and is currently estimated at $754,333, approximately $363 per square foot. 716 Findlay Ave is a home located in Los Angeles County with nearby schools including Bella Vista Elementary School, Macy Intermediate School, and Schurr High School.
Ownership History
Date
Name
Owned For
Owner Type
Purchase Details
Closed on
Oct 14, 2021
Sold by
Ernest Haro T and Ernest Julia T
Bought by
Ernest Haro And Julia I Haro Revocable Living and Ernest Julia R
Current Estimated Value
Purchase Details
Closed on
May 14, 2004
Sold by
Haro Ernest and Haro Julia I
Bought by
Haro Ernest and Haro Julia I
Home Financials for this Owner
Home Financials are based on the most recent Mortgage that was taken out on this home.
Original Mortgage
$246,000
Interest Rate
4.49%
Mortgage Type
Negative Amortization
Purchase Details
Closed on
Apr 9, 2004
Sold by
Haro Ernest and Haro Julia I
Bought by
Haro Ernest and Haro Julia I
Home Financials for this Owner
Home Financials are based on the most recent Mortgage that was taken out on this home.
Original Mortgage
$246,000
Interest Rate
4.49%
Mortgage Type
Negative Amortization
Purchase Details
Closed on
Dec 12, 2001
Sold by
Haro Ernest and Haro Julia I
Bought by
Haro Ernest and Haro Julia I
Create a Home Valuation Report for This Property
The Home Valuation Report is an in-depth analysis detailing your home's value as well as a comparison with similar homes in the area
Home Values in the Area
Average Home Value in this Area
Purchase History
| Date | Buyer | Sale Price | Title Company |
|---|---|---|---|
| Ernest Haro And Julia I Haro Revocable Living | -- | None Listed On Document | |
| Haro Ernest | -- | -- | |
| Haro Ernest | -- | Ticor Title Company | |
| Haro Ernest | -- | -- |
Source: Public Records
Mortgage History
| Date | Status | Borrower | Loan Amount |
|---|---|---|---|
| Previous Owner | Haro Ernest | $246,000 |
Source: Public Records
Tax History Compared to Growth
Tax History
| Year | Tax Paid | Tax Assessment Tax Assessment Total Assessment is a certain percentage of the fair market value that is determined by local assessors to be the total taxable value of land and additions on the property. | Land | Improvement |
|---|---|---|---|---|
| 2025 | $3,151 | $115,455 | $37,163 | $78,292 |
| 2024 | $3,151 | $113,192 | $36,435 | $76,757 |
| 2023 | $2,887 | $110,973 | $35,721 | $75,252 |
| 2022 | $2,823 | $108,798 | $35,021 | $73,777 |
| 2021 | $2,753 | $106,666 | $34,335 | $72,331 |
| 2020 | $2,739 | $105,573 | $33,983 | $71,590 |
| 2019 | $2,689 | $103,504 | $33,317 | $70,187 |
| 2018 | $2,605 | $101,475 | $32,664 | $68,811 |
| 2016 | $2,500 | $97,537 | $31,397 | $66,140 |
| 2015 | $2,415 | $96,073 | $30,926 | $65,147 |
| 2014 | $2,412 | $94,192 | $30,321 | $63,871 |
Source: Public Records
Map
Nearby Homes
- 6114 Allston St
- 413 Brady Ave
- 678 Saybrook Ave
- 6074 Dennison St
- 631 Leonard Ave
- 6211 E Olympic Blvd
- 3033 W Via Corona
- 6128 E Olympic Blvd
- 5838 Allston St
- 601 Keenan Ave
- 668 Keenan Ave
- 6434 E Olympic Blvd
- 544 Keenan Ave
- 6501 E Olympic Blvd
- 3413 W Beverly Blvd
- 532 Keenan Ave
- 2912 W Via Acosta
- 6057 Hereford Dr
- 6041 Ferguson Dr
- 637 Leonard St
- 722 Findlay Ave
- 710 Findlay Ave
- 726 Findlay Ave
- 708 Findlay Ave
- 732 Findlay Ave
- 727 Brady Ave
- 700 Findlay Ave
- 6142 Hubbard St
- 731 Brady Ave
- 711 Findlay Ave
- 721 Findlay Ave
- 736 Findlay Ave
- 701 Brady Ave
- 727 Findlay Ave
- 705 Findlay Ave
- 737 Brady Ave
- 701 Findlay Ave
- 733 Findlay Ave
- 742 Findlay Ave
- 739 Brady Ave