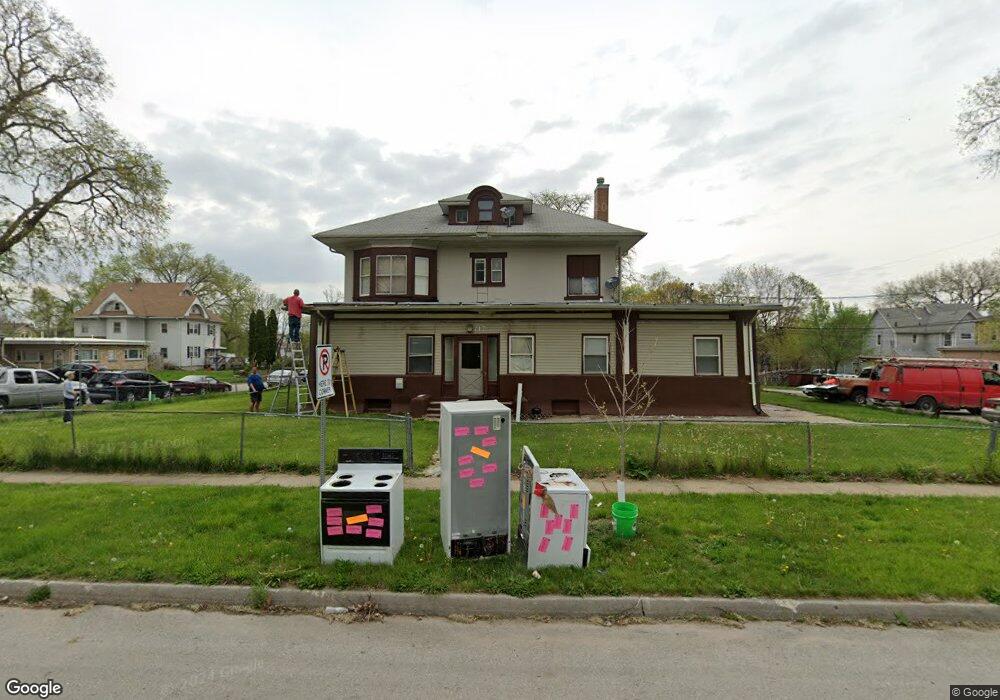
717 Franklin Ave Unit 11 Des Moines, IA 50314
River Bend NeighborhoodEstimated Value: $288,000
--
Bed
6
Baths
8,466
Sq Ft
$34/Sq Ft
Est. Value
About This Home
This home is located at 717 Franklin Ave Unit 11, Des Moines, IA 50314 and is currently estimated at $288,000, approximately $34 per square foot. 717 Franklin Ave Unit 11 is a home located in Polk County with nearby schools including Moulton Elementary School, Harding Middle School, and North High School.
Ownership History
Date
Name
Owned For
Owner Type
Purchase Details
Closed on
Nov 5, 2015
Sold by
Pak Kwon and Lee Isabel
Bought by
Ki Properties Llc
Current Estimated Value
Purchase Details
Closed on
Sep 23, 2015
Sold by
Mendez Multiservices Inc
Bought by
Pak Kwon and Lee Isabel
Purchase Details
Closed on
Jul 18, 2012
Sold by
Mendez Aurelio and Mendez Magdalena
Bought by
Mendez Multiservices Inc
Purchase Details
Closed on
Jul 8, 2005
Sold by
Mendez Pastor and Mendez Maria
Bought by
Mendez Aurelio
Purchase Details
Closed on
Feb 18, 2004
Sold by
Ssw Properties Llc
Bought by
Mendez Pastor and Mendez Maria
Home Financials for this Owner
Home Financials are based on the most recent Mortgage that was taken out on this home.
Original Mortgage
$50,250
Interest Rate
5.75%
Mortgage Type
Commercial
Purchase Details
Closed on
Jan 31, 2002
Sold by
Lu Vieng and Khongmaly Manivong
Bought by
Ssw Properties
Home Financials for this Owner
Home Financials are based on the most recent Mortgage that was taken out on this home.
Original Mortgage
$55,800
Interest Rate
7.26%
Mortgage Type
Commercial
Purchase Details
Closed on
Dec 12, 1999
Sold by
Egkhounmuong Bounthieng and Egkhounmuong Manichanh
Bought by
Lu Vieng and Khongmaly Manivong
Create a Home Valuation Report for This Property
The Home Valuation Report is an in-depth analysis detailing your home's value as well as a comparison with similar homes in the area
Home Values in the Area
Average Home Value in this Area
Purchase History
| Date | Buyer | Sale Price | Title Company |
|---|---|---|---|
| Ki Properties Llc | -- | None Available | |
| Pak Kwon | $115,000 | None Available | |
| Mendez Multiservices Inc | -- | None Available | |
| Mendez Aurelio | -- | -- | |
| Mendez Pastor | $66,500 | -- | |
| Ssw Properties | $61,500 | -- | |
| Lu Vieng | $49,500 | -- |
Source: Public Records
Mortgage History
| Date | Status | Borrower | Loan Amount |
|---|---|---|---|
| Previous Owner | Mendez Pastor | $50,250 | |
| Previous Owner | Ssw Properties | $55,800 |
Source: Public Records
Tax History Compared to Growth
Tax History
| Year | Tax Paid | Tax Assessment Tax Assessment Total Assessment is a certain percentage of the fair market value that is determined by local assessors to be the total taxable value of land and additions on the property. | Land | Improvement |
|---|---|---|---|---|
| 2024 | $2,970 | $151,000 | $14,000 | $137,000 |
| 2023 | $2,898 | $151,000 | $14,000 | $137,000 |
| 2022 | $3,388 | $123,000 | $11,700 | $111,300 |
| 2021 | $3,016 | $123,000 | $11,700 | $111,300 |
| 2020 | $3,388 | $101,000 | $10,600 | $90,400 |
| 2019 | $2,956 | $101,000 | $10,600 | $90,400 |
| 2018 | $3,146 | $83,500 | $10,600 | $72,900 |
| 2017 | $2,958 | $83,500 | $10,600 | $72,900 |
| 2016 | $3,084 | $75,500 | $8,900 | $66,600 |
| 2015 | $3,084 | $75,500 | $8,900 | $66,600 |
| 2014 | $2,874 | $67,000 | $8,900 | $58,100 |
Source: Public Records
Map
Nearby Homes