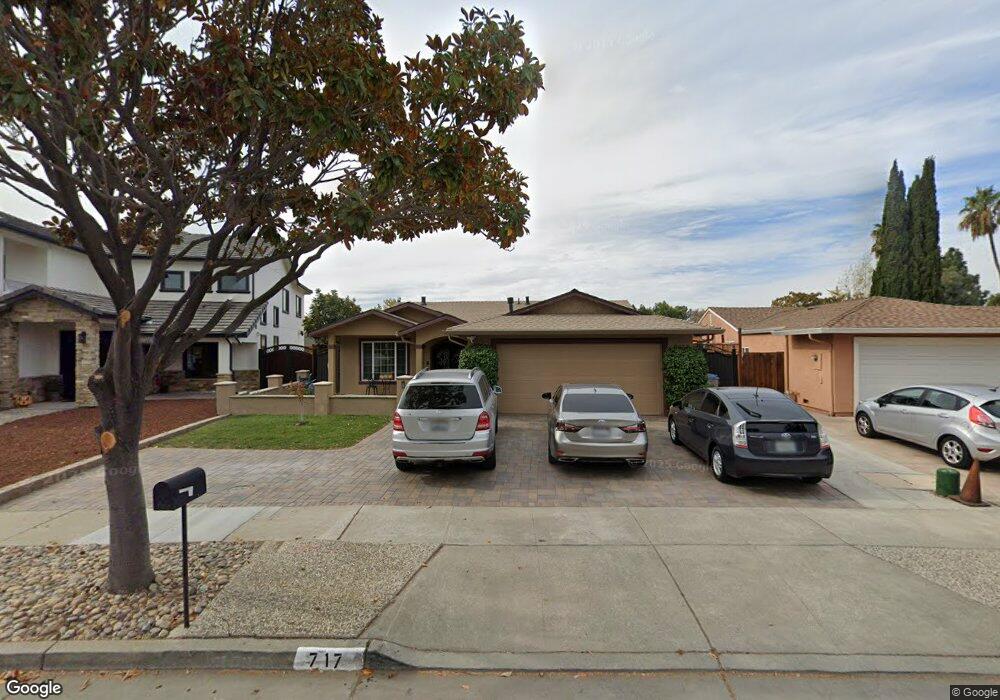
717 Lava Way San Jose, CA 95133
Commodore NeighborhoodEstimated Value: $1,218,000 - $1,432,775
4
Beds
3
Baths
2,140
Sq Ft
$621/Sq Ft
Est. Value
About This Home
This home is located at 717 Lava Way, San Jose, CA 95133 and is currently estimated at $1,329,444, approximately $621 per square foot. 717 Lava Way is a home located in Santa Clara County with nearby schools including Summerdale Elementary School, Piedmont Middle School, and Independence High School.
Ownership History
Date
Name
Owned For
Owner Type
Purchase Details
Closed on
Nov 25, 2024
Sold by
Bola Birbal S and Bola Surinder K
Bought by
Birbal And Surinder Bola Family Trust and Bola
Current Estimated Value
Purchase Details
Closed on
Jan 12, 1998
Sold by
Birbal Singh and Birbal S
Bought by
Bola Birbal S and Bola Surinder K
Home Financials for this Owner
Home Financials are based on the most recent Mortgage that was taken out on this home.
Original Mortgage
$147,000
Interest Rate
7.13%
Purchase Details
Closed on
Nov 26, 1996
Sold by
Bola Karnail S
Bought by
Singh Birbal
Create a Home Valuation Report for This Property
The Home Valuation Report is an in-depth analysis detailing your home's value as well as a comparison with similar homes in the area
Home Values in the Area
Average Home Value in this Area
Purchase History
| Date | Buyer | Sale Price | Title Company |
|---|---|---|---|
| Birbal And Surinder Bola Family Trust | -- | None Listed On Document | |
| Birbal And Surinder Bola Family Trust | -- | None Listed On Document | |
| Bola Birbal S | -- | Commonwealth Land Title Co | |
| Singh Birbal | -- | -- |
Source: Public Records
Mortgage History
| Date | Status | Borrower | Loan Amount |
|---|---|---|---|
| Previous Owner | Bola Birbal S | $147,000 |
Source: Public Records
Tax History Compared to Growth
Tax History
| Year | Tax Paid | Tax Assessment Tax Assessment Total Assessment is a certain percentage of the fair market value that is determined by local assessors to be the total taxable value of land and additions on the property. | Land | Improvement |
|---|---|---|---|---|
| 2025 | $7,156 | $459,296 | $130,008 | $329,288 |
| 2024 | $7,156 | $450,291 | $127,459 | $322,832 |
| 2023 | $7,007 | $441,462 | $124,960 | $316,502 |
| 2022 | $6,972 | $432,807 | $122,510 | $310,297 |
| 2021 | $6,727 | $424,321 | $120,108 | $304,213 |
| 2020 | $6,504 | $419,971 | $118,877 | $301,094 |
| 2019 | $6,253 | $411,738 | $116,547 | $295,191 |
| 2018 | $6,155 | $403,665 | $114,262 | $289,403 |
| 2017 | $4,698 | $280,065 | $112,022 | $168,043 |
| 2016 | $4,498 | $274,575 | $109,826 | $164,749 |
| 2015 | $4,438 | $270,452 | $108,177 | $162,275 |
| 2014 | $3,897 | $265,155 | $106,058 | $159,097 |
Source: Public Records
Map
Nearby Homes
- 2369 Mabury Rd
- 709 Whitewater Ct Unit 44
- 633 Easton Dr
- 674 Galleon Ct
- 832 N Jackson Ave
- 2420 Kita Ln
- 2432 Kita Ln
- 2580 Gimelli Way
- 12280 Mabury Rd
- 2599 Easton Ln Unit 108
- 2599 Easton Ln Unit 109
- 2328 Mossdale Way
- 571 Apricot Way
- 559 Apricot Way
- 750 Fruit Ranch Loop
- 1957 Cape Horn Dr
- 2623 Gimelli Place Unit 139
- 714 N Capitol Ave
- 825 N Capitol Ave Unit 4
- 370 Englert Ct