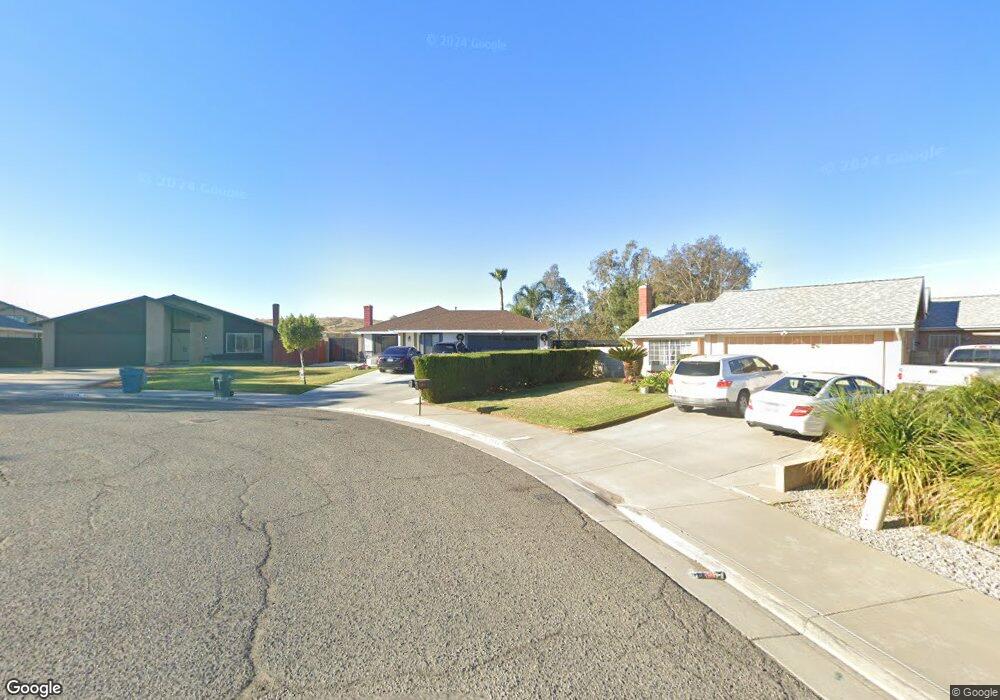
7177 Auld St Riverside, CA 92503
Arlanza NeighborhoodEstimated Value: $619,000 - $691,560
4
Beds
2
Baths
1,600
Sq Ft
$411/Sq Ft
Est. Value
About This Home
This home is located at 7177 Auld St, Riverside, CA 92503 and is currently estimated at $656,890, approximately $410 per square foot. 7177 Auld St is a home located in Riverside County with nearby schools including Rosemary Kennedy Elementary School, Loma Vista Middle School, and Norte Vista High School.
Ownership History
Date
Name
Owned For
Owner Type
Purchase Details
Closed on
Dec 27, 2012
Sold by
West John L and West Beverly J
Bought by
West John L and The Jb West Trust
Current Estimated Value
Purchase Details
Closed on
Dec 15, 2008
Sold by
Cox Henry C and Cox Jacqueline N
Bought by
Cox Ii Henry C and Cox Jacqueline N
Purchase Details
Closed on
Sep 19, 2005
Sold by
Gonzalez Servando and Gonzalez Alba
Bought by
Arambula Ramon I and Arambula Dalila
Home Financials for this Owner
Home Financials are based on the most recent Mortgage that was taken out on this home.
Original Mortgage
$394,250
Interest Rate
4.37%
Mortgage Type
Negative Amortization
Purchase Details
Closed on
Feb 15, 1996
Sold by
Gonzalez Servando and Gonzalez Alba
Bought by
Gonzalez Servando and Gonzalez Alba
Purchase Details
Closed on
Nov 8, 1995
Sold by
Gonzalez Servando and Gonzalez Alba
Bought by
Gonzalez Servando and Gonzalez Alba
Purchase Details
Closed on
Nov 7, 1995
Sold by
Gereau Jeri Kathleen
Bought by
Gonzalez Servando and Gonzalez Alba
Create a Home Valuation Report for This Property
The Home Valuation Report is an in-depth analysis detailing your home's value as well as a comparison with similar homes in the area
Home Values in the Area
Average Home Value in this Area
Purchase History
| Date | Buyer | Sale Price | Title Company |
|---|---|---|---|
| West John L | -- | None Available | |
| Cox Ii Henry C | -- | None Available | |
| Cox Ii Henry C | -- | None Available | |
| Arambula Ramon I | $415,000 | Fnt | |
| Gonzalez Servando | -- | -- | |
| Gonzalez Servando | -- | -- | |
| Gonzalez Servando | -- | -- |
Source: Public Records
Mortgage History
| Date | Status | Borrower | Loan Amount |
|---|---|---|---|
| Previous Owner | Arambula Ramon I | $394,250 |
Source: Public Records
Tax History
| Year | Tax Paid | Tax Assessment Tax Assessment Total Assessment is a certain percentage of the fair market value that is determined by local assessors to be the total taxable value of land and additions on the property. | Land | Improvement |
|---|---|---|---|---|
| 2025 | $7,372 | $614,460 | $95,647 | $518,813 |
| 2023 | $7,372 | $590,602 | $91,934 | $498,668 |
| 2022 | $6,655 | $564,863 | $87,773 | $477,090 |
| 2021 | $5,664 | $478,698 | $74,384 | $404,314 |
| 2020 | $5,034 | $427,408 | $66,414 | $360,994 |
| 2019 | $4,921 | $414,960 | $64,480 | $350,480 |
| 2018 | $4,761 | $399,000 | $62,000 | $337,000 |
| 2017 | $4,388 | $367,000 | $57,000 | $310,000 |
| 2016 | $3,929 | $327,000 | $55,000 | $272,000 |
| 2015 | $3,859 | $321,000 | $54,000 | $267,000 |
| 2014 | $3,214 | $262,000 | $44,000 | $218,000 |
Source: Public Records
Map
Nearby Homes
- 10201 Oxbow Loop
- 7051 Idyllwild Ln
- 7000 Batavia Way
- 10022 Chula Vista Way
- 9731 Lasorda Ct
- 7283 Dimaggio St
- 9669 Jurupa Ave
- 6940 Keating Dr
- 6750 Astoria Dr
- 10060 Hillsborough Ln
- 6691 Dorinda Dr
- 6465 Archer St
- 8727 Randolph St
- 10849 Morning View Ct
- 8925 Penny Dr
- 10115 Onyx Way
- 8654 Greenpoint Ave
- 8476 Perada St
- 9240 Limonite Ave
- 9451 Rancho Jurupa Dr
- 10270 Dunn Ct
- 7183 Auld St
- 10260 Dunn Ct
- 7191 Auld St
- 10250 Dunn Ct
- 7197 Auld St
- 10269 Dunn Ct
- 10240 Dunn Ct
- 7169 Squall Dr Unit 36434903
- 7169 Squall Dr
- 10285 Surge Ln
- 7175 Squall Dr
- 10287 Ebro Dr
- 10298 Runnel Ln
- 10296 Ebro Dr
- 10293 Benthos Dr
- 10283 Benthos Dr
- 10281 Trickle Ln
- 10294 Surge Ln
- 10259 Dunn Ct
Your Personal Tour Guide
Ask me questions while you tour the home.