

718 Locust St Denver, CO 80220
Montclair NeighborhoodEstimated payment $8,646/month
Highlights
- Heated Driveway
- Primary Bedroom Suite
- Vaulted Ceiling
- Carson Elementary School Rated A-
- Fireplace in Primary Bedroom
- Wood Flooring
About This Home
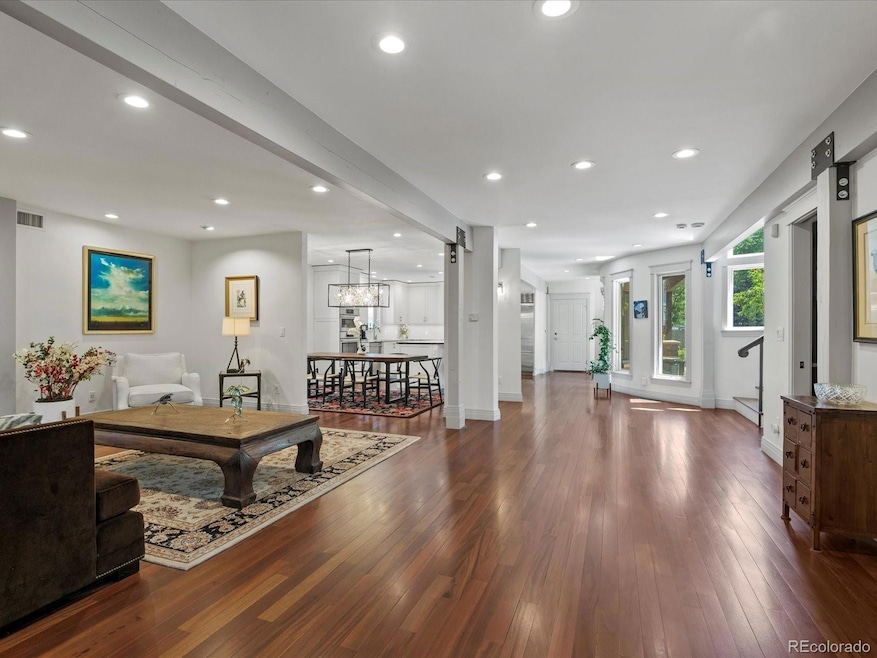
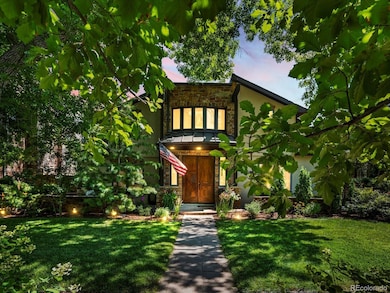
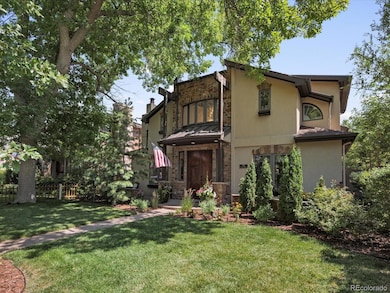
Timeless Elegance Meets Modern Luxury at 718 Locust Street
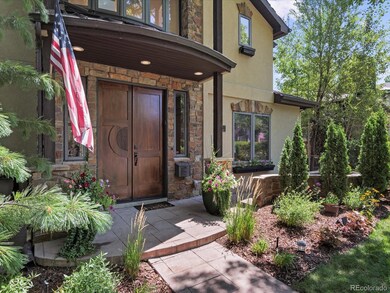
Tucked away on a tree-lined street in Denver’s coveted Montclair neighborhood, this exquisite residence offers a refined blend of historic charm and contemporary comfort. From the moment you arrive, the home’s classic architecture, manicured landscaping, and inviting curb appeal set the stage for something truly special. Inside, warm hardwood floors and abundant natural light flow through a thoughtfully designed layout featuring spacious living areas, high-end finishes, and sophisticated details throughout. The chef’s kitchen is a standout, with custom cabinetry, premium appliances, and seamless access to the heart of the home, an outdoor oasis unlike any other.
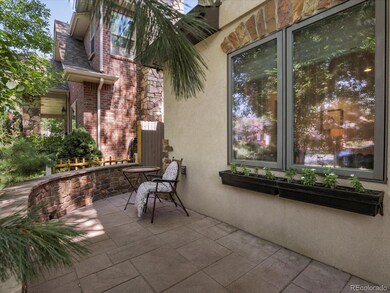
Step into the European-inspired courtyard, where old-world ambiance meets Colorado skies. Enclosed for privacy and adorned with lush greenery, stone pavers, and ambient lighting, this al fresco space evokes the romance of Tuscany or Provence. Whether you're sipping morning espresso, hosting twilight dinners, or simply relaxing by the fire, this serene retreat offers an unmatched lifestyle experience. The home includes multiple bedrooms and spa-like baths, a luxurious primary suite, and versatile bonus spaces perfect for a home office or guest quarters. Every detail reflects craftsmanship and comfort.
Located minutes from Cherry Creek, City Park, and top-rated schools, this property balances tranquility with convenience. 718 Locust Street isn’t just a home, it’s a destination.
Listing Agent
Accession Real Estate Brokerage Email: kyle@accessionre.com,720-520-4448 License #100088385 Listed on: 08/28/2025
Home Details
Home Type
- Single Family
Est. Annual Taxes
- $8,033
Year Built
- Built in 2003
Lot Details
- 5,850 Sq Ft Lot
- West Facing Home
- Property is Fully Fenced
- Landscaped
- Level Lot
- Front and Back Yard Sprinklers
- Private Yard
- Property is zoned E-SU-DX
Parking
- 2 Car Attached Garage
- Heated Garage
- Exterior Access Door
- Heated Driveway
Home Design
- Rustic Architecture
- Frame Construction
- Composition Roof
- Metal Roof
- Stone Siding
- Concrete Block And Stucco Construction
Interior Spaces
- 2-Story Property
- Wet Bar
- Vaulted Ceiling
- Ceiling Fan
- Gas Log Fireplace
- Double Pane Windows
- Family Room with Fireplace
- 2 Fireplaces
- Dining Room
- Loft
- Bonus Room
- Finished Basement
- Partial Basement
Kitchen
- Double Self-Cleaning Convection Oven
- Range Hood
- Microwave
- Dishwasher
- Wine Cooler
- Kitchen Island
- Quartz Countertops
- Disposal
Flooring
- Wood
- Carpet
- Tile
Bedrooms and Bathrooms
- Fireplace in Primary Bedroom
- Primary Bedroom Suite
- Walk-In Closet
Laundry
- Laundry in unit
- Dryer
- Washer
Home Security
- Carbon Monoxide Detectors
- Fire and Smoke Detector
Outdoor Features
- Balcony
- Patio
Schools
- Carson Elementary School
- Hill Middle School
- George Washington High School
Utilities
- Central Air
- Heating System Uses Natural Gas
- Radiant Heating System
- 220 Volts
- 110 Volts
- Natural Gas Connected
- Gas Water Heater
Community Details
- No Home Owners Association
- Porter & Raymonds Montclair Subdivision
Listing and Financial Details
- Exclusions: Seller Personal Property
- Assessor Parcel Number 6053-37-005
Map
Home Values in the Area
Average Home Value in this Area
Tax History
| Year | Tax Paid | Tax Assessment Tax Assessment Total Assessment is a certain percentage of the fair market value that is determined by local assessors to be the total taxable value of land and additions on the property. | Land | Improvement |
|---|---|---|---|---|
| 2025 | $8,033 | $121,550 | $41,020 | $41,020 |
| 2024 | $8,033 | $101,420 | $35,300 | $66,120 |
| 2023 | $7,859 | $101,420 | $35,300 | $66,120 |
| 2022 | $5,798 | $72,910 | $22,240 | $50,670 |
| 2021 | $5,597 | $75,010 | $22,880 | $52,130 |
| 2020 | $5,674 | $76,470 | $22,880 | $53,590 |
| 2019 | $5,515 | $76,470 | $22,880 | $53,590 |
| 2018 | $5,225 | $67,540 | $20,950 | $46,590 |
| 2017 | $5,210 | $67,540 | $20,950 | $46,590 |
| 2016 | $5,667 | $69,490 | $22,001 | $47,489 |
| 2015 | $5,429 | $73,950 | $22,001 | $51,949 |
| 2014 | $5,683 | $68,430 | $17,369 | $51,061 |
Property History
| Date | Event | Price | List to Sale | Price per Sq Ft |
|---|---|---|---|---|
| 02/18/2026 02/18/26 | Price Changed | $1,550,000 | -3.1% | $391 / Sq Ft |
| 02/17/2026 02/17/26 | Price Changed | $1,600,000 | 0.0% | $404 / Sq Ft |
| 02/17/2026 02/17/26 | For Sale | $1,600,000 | +3.2% | $404 / Sq Ft |
| 12/05/2025 12/05/25 | Off Market | $1,550,000 | -- | -- |
| 11/03/2025 11/03/25 | Price Changed | $1,550,000 | +3.3% | $391 / Sq Ft |
| 08/28/2025 08/28/25 | For Sale | $1,500,000 | -- | $379 / Sq Ft |
Purchase History
| Date | Type | Sale Price | Title Company |
|---|---|---|---|
| Special Warranty Deed | -- | None Listed On Document | |
| Warranty Deed | $1,140,000 | First Integrity Title | |
| Warranty Deed | $750,000 | Stewart Title | |
| Warranty Deed | $825,000 | Land Title Guarantee Company | |
| Warranty Deed | $320,000 | -- | |
| Interfamily Deed Transfer | -- | -- | |
| Warranty Deed | $196,950 | -- | |
| Joint Tenancy Deed | $125,000 | Land Title |
Mortgage History
| Date | Status | Loan Amount | Loan Type |
|---|---|---|---|
| Previous Owner | $417,000 | Purchase Money Mortgage | |
| Previous Owner | $630,000 | Purchase Money Mortgage | |
| Previous Owner | $658,710 | Construction | |
| Previous Owner | $560,000 | Purchase Money Mortgage | |
| Previous Owner | $159,200 | Construction | |
| Previous Owner | $91,875 | No Value Available |
Source: REcolorado®
MLS Number: 2967149
APN: 6053-37-005
Disclaimer: Certain information contained herein is derived from information provided by parties other than Homes.com. All information provided is deemed reliable, but is not guaranteed to be accurate and should be independently verified.
![]() Based on information submitted to the MLS GRID. All data is obtained from various sources and may not have been verified by broker or MLS GRID. Supplied Open House Information is subject to change without notice. All information should be independently reviewed and verified for accuracy. Properties may or may not be listed by the office/agent presenting the information. Some IDX listings have been excluded from this website. The content relating to real estate for sale in this Web site comes in part from the Internet Data eXchange (“IDX”) program of METROLIST, INC., DBA RECOLORADO®. Real estate listings held by brokers other than Ten-X are marked with the IDX Logo. This information is being provided for the consumers’ personal, non-commercial use and may not be used for any other purpose. All information is subject to change and should be independently verified.
Based on information submitted to the MLS GRID. All data is obtained from various sources and may not have been verified by broker or MLS GRID. Supplied Open House Information is subject to change without notice. All information should be independently reviewed and verified for accuracy. Properties may or may not be listed by the office/agent presenting the information. Some IDX listings have been excluded from this website. The content relating to real estate for sale in this Web site comes in part from the Internet Data eXchange (“IDX”) program of METROLIST, INC., DBA RECOLORADO®. Real estate listings held by brokers other than Ten-X are marked with the IDX Logo. This information is being provided for the consumers’ personal, non-commercial use and may not be used for any other purpose. All information is subject to change and should be independently verified.
This publication is designed to provide information with regard to the subject matter covered. It is displayed with the understanding that the publisher and authors are not engaged in rendering real estate, legal, accounting, tax, or other professional services and that the publisher and authors are not offering such advice in this publication. If real estate, legal, or other expert assistance is required, the services of a competent, professional person should be sought.
The information contained in this publication is subject to change without notice. METROLIST, INC., DBA RECOLORADO MAKES NO WARRANTY OF ANY KIND WITH REGARD TO THIS MATERIAL, INCLUDING, BUT NOT LIMITED TO, THE IMPLIED WARRANTIES OF MERCHANTABILITY AND FITNESS FOR A PARTICULAR PURPOSE. METROLIST, INC., DBA RECOLORADO SHALL NOT BE LIABLE FOR ERRORS CONTAINED HEREIN OR FOR ANY DAMAGES IN CONNECTION WITH THE FURNISHING, PERFORMANCE, OR USE OF THIS MATERIAL.
PUBLISHER’S NOTICE: All real estate advertised herein is subject to the Federal Fair Housing Act and the Colorado Fair Housing Act, which Acts make it illegal to make or publish any advertisement that indicates any preference, limitation, or discrimination based on race, color, religion, sex, handicap, familial status, or national origin.
METROLIST, INC., DBA RECOLORADO will not knowingly accept any advertising for real estate that is in violation of the law. All persons are hereby informed that all dwellings advertised are available on an equal opportunity basis.
© 2026 METROLIST, INC., DBA RECOLORADO® – All Rights Reserved. 6455 S. Yosemite St., Suite 500 Greenwood Village, CO 80111 USA
ALL RIGHTS RESERVED WORLDWIDE. No part of this publication may be reproduced, adapted, translated, stored in a retrieval system or transmitted in any form or by any means, electronic, mechanical, photocopying, recording, or otherwise, without the prior written permission of the publisher. The information contained herein including but not limited to all text, photographs, digital images, virtual tours, may be seeded and monitored for protection and tracking.
Based on information submitted to the MLS GRID
- 750 Kearney St
- 765 Kearney St
- 463 Locust St
- 795 Jasmine St
- 760 Jersey St
- 825 Jasmine St
- 940 Kearney St
- 625 Jersey St
- 1035 Leyden St
- 1045 Locust St
- 404 Kearney St
- 6 Ivy Ln
- 335 Leyden St
- 7030 E 7th Ave
- 742 Ivanhoe St
- 5955 E 10th Ave Unit 409
- 5820 E 10th Ave
- 1058 Jasmine St
- 944 Ivanhoe St
- 230 Monaco Pkwy
- 1055 Leyden St
- 5701 E 8th Ave
- 1125 Olive St
- 794 Glencoe St
- 80 Niagara St
- 16 Oneida Ct
- 200 Rampart Way
- 1124 Rosemary St Unit 5
- 7108 E Lowry Blvd
- 7175 E 14th Ave
- 920 Eudora St Unit 102
- 1531 S Leyden St
- 955 Eudora St Unit 104E
- 955 Eudora St Unit 708E
- 240 S Monaco Pkwy
- 800 Dexter St
- 8001 E 11th Ave
- 764-794 Cherry St
- 800 Cherry St
- 850 Cherry St

Ask me questions while you tour the home.