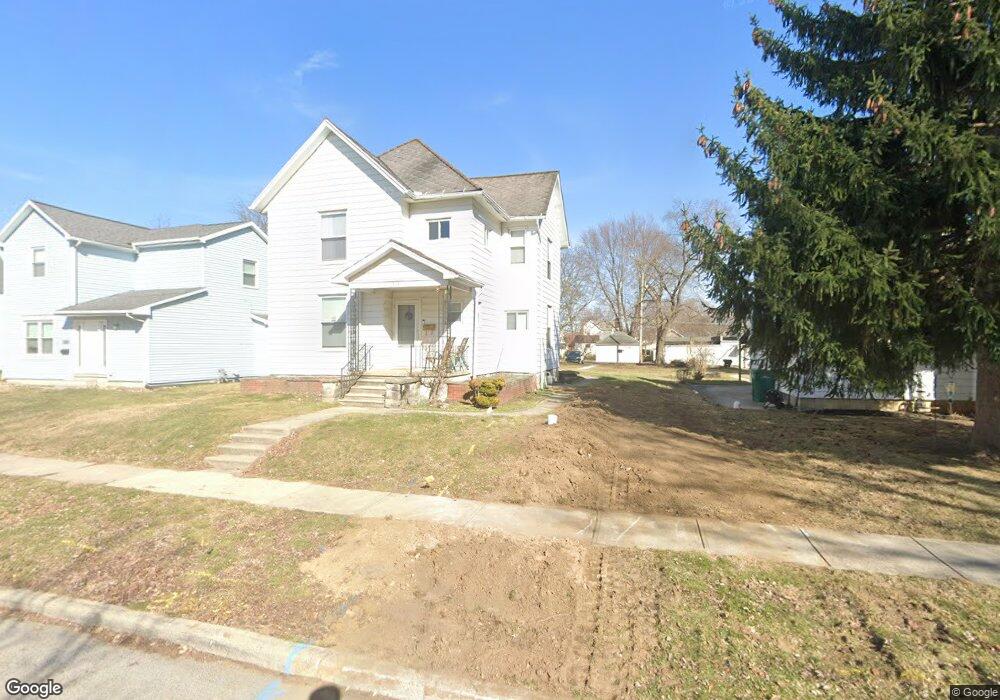
719 Franklin Ave Findlay, OH 45840
Estimated Value: $149,170 - $198,000
5
Beds
2
Baths
1,632
Sq Ft
$105/Sq Ft
Est. Value
About This Home
This home is located at 719 Franklin Ave, Findlay, OH 45840 and is currently estimated at $171,293, approximately $104 per square foot. 719 Franklin Ave is a home located in Hancock County with nearby schools including Whittier Primary School, Bigelow Hill Elementary School, and Glenwood Middle School.
Ownership History
Date
Name
Owned For
Owner Type
Purchase Details
Closed on
Apr 10, 2023
Sold by
Kirian Rentals Llc
Bought by
Kirian Dean A and Kirian Jane E
Current Estimated Value
Purchase Details
Closed on
Jun 5, 2000
Sold by
Loach Gregg A
Bought by
Kirian Dean A and Kirian Jane E
Home Financials for this Owner
Home Financials are based on the most recent Mortgage that was taken out on this home.
Original Mortgage
$63,200
Interest Rate
7.85%
Mortgage Type
New Conventional
Purchase Details
Closed on
Jun 10, 1997
Sold by
Piehl David
Bought by
Loach Gregg and Loach Mary
Home Financials for this Owner
Home Financials are based on the most recent Mortgage that was taken out on this home.
Original Mortgage
$64,506
Interest Rate
8.17%
Mortgage Type
New Conventional
Purchase Details
Closed on
May 24, 1993
Bought by
Piehl David A and Mary Jane
Purchase Details
Closed on
Mar 18, 1982
Bought by
Bibler Gyneth
Create a Home Valuation Report for This Property
The Home Valuation Report is an in-depth analysis detailing your home's value as well as a comparison with similar homes in the area
Home Values in the Area
Average Home Value in this Area
Purchase History
| Date | Buyer | Sale Price | Title Company |
|---|---|---|---|
| Kirian Dean A | -- | None Listed On Document | |
| Kirian Dean A | $79,000 | -- | |
| Loach Gregg | $68,000 | -- | |
| Piehl David A | $55,000 | -- | |
| Bibler Gyneth | -- | -- |
Source: Public Records
Mortgage History
| Date | Status | Borrower | Loan Amount |
|---|---|---|---|
| Previous Owner | Kirian Dean A | $63,200 | |
| Previous Owner | Loach Gregg | $64,506 |
Source: Public Records
Tax History Compared to Growth
Tax History
| Year | Tax Paid | Tax Assessment Tax Assessment Total Assessment is a certain percentage of the fair market value that is determined by local assessors to be the total taxable value of land and additions on the property. | Land | Improvement |
|---|---|---|---|---|
| 2024 | $1,351 | $37,060 | $5,460 | $31,600 |
| 2023 | $1,353 | $37,060 | $5,460 | $31,600 |
| 2022 | $1,348 | $37,060 | $5,460 | $31,600 |
| 2021 | $1,200 | $28,740 | $5,450 | $23,290 |
| 2020 | $1,200 | $28,740 | $5,450 | $23,290 |
| 2019 | $1,177 | $28,740 | $5,450 | $23,290 |
| 2018 | $1,115 | $24,990 | $4,740 | $20,250 |
| 2017 | $1,116 | $24,990 | $4,740 | $20,250 |
| 2016 | $1,110 | $24,990 | $4,740 | $20,250 |
| 2015 | $1,045 | $23,240 | $4,740 | $18,500 |
| 2014 | $1,045 | $23,240 | $4,740 | $18,500 |
| 2012 | $1,053 | $23,240 | $4,740 | $18,500 |
Source: Public Records
Map
Nearby Homes
- 706 N Cory St
- 224 Defiance Ave
- 512 N Cory St
- 207 Ash Ave
- 524 Defiance Ave
- 115 George St
- 213 Cherry St
- 0 Canadian Way Unit 20253551
- 0 Canadian Way Unit 6135400
- 533 Davis St
- 247 Crystal Ave
- 206 Midland Ave
- 604 Davis St
- 230 Midland Ave
- 407 Washington St
- 1005 Broad Ave
- 210 Western Ave
- 334 E Foulke Ave
- 420 Allen Ave
- 410 Monroe Ave
- 723 Franklin Ave
- 715 Franklin Ave
- 713 Franklin Ave
- 803 Franklin Ave
- 805 Franklin Ave
- 709 Franklin Ave
- 705 Franklin Ave
- 720 N Cory St
- 807 Franklin Ave
- 714 N Cory St
- 724 N Cory St
- 720 Franklin Ave
- 722 Franklin Ave
- 716 Franklin Ave
- 800 N Cory St
- 712 Franklin Ave
- 800 Franklin Ave
- 811 Franklin Ave
- 701 Franklin Ave
- 706 Franklin Ave