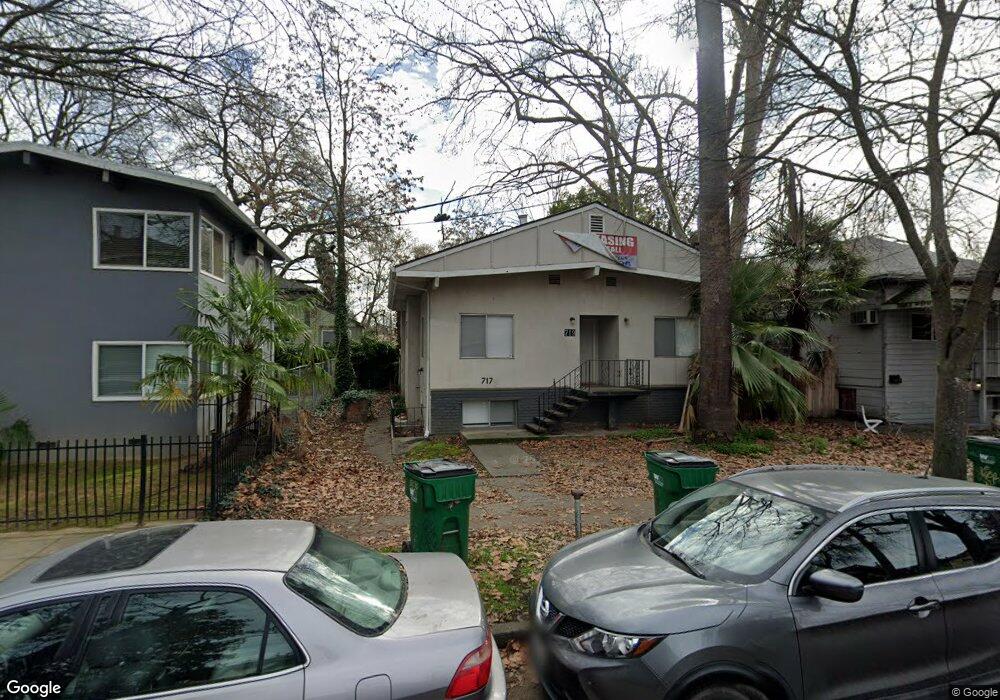
719 W 3rd St Chico, CA 95928
South Campus NeighborhoodEstimated Value: $435,000 - $650,000
7
Beds
4
Baths
2,175
Sq Ft
$234/Sq Ft
Est. Value
About This Home
This home is located at 719 W 3rd St, Chico, CA 95928 and is currently estimated at $509,298, approximately $234 per square foot. 719 W 3rd St is a home located in Butte County with nearby schools including Citrus Avenue Elementary School, Chico Junior High School, and Chico High School.
Ownership History
Date
Name
Owned For
Owner Type
Purchase Details
Closed on
Sep 23, 2020
Sold by
Fong Evelyn H
Bought by
Fong Trust and Fong
Current Estimated Value
Purchase Details
Closed on
Jan 10, 2011
Sold by
Futch Robert M and Futch Karen L
Bought by
Fong Evelyn H
Home Financials for this Owner
Home Financials are based on the most recent Mortgage that was taken out on this home.
Original Mortgage
$160,000
Interest Rate
4.43%
Mortgage Type
New Conventional
Purchase Details
Closed on
Nov 5, 1997
Sold by
Ferguson Marie R
Bought by
Futch Robert M and Futch Karen L
Home Financials for this Owner
Home Financials are based on the most recent Mortgage that was taken out on this home.
Original Mortgage
$107,000
Interest Rate
4.25%
Create a Home Valuation Report for This Property
The Home Valuation Report is an in-depth analysis detailing your home's value as well as a comparison with similar homes in the area
Home Values in the Area
Average Home Value in this Area
Purchase History
| Date | Buyer | Sale Price | Title Company |
|---|---|---|---|
| Fong Trust | -- | None Listed On Document | |
| Fong Evelyn H | $350,000 | Bidwell Title & Escrow Co | |
| Futch Robert M | $142,000 | Fidelity National Title Co |
Source: Public Records
Mortgage History
| Date | Status | Borrower | Loan Amount |
|---|---|---|---|
| Previous Owner | Fong Evelyn H | $160,000 | |
| Previous Owner | Futch Robert M | $107,000 |
Source: Public Records
Tax History
| Year | Tax Paid | Tax Assessment Tax Assessment Total Assessment is a certain percentage of the fair market value that is determined by local assessors to be the total taxable value of land and additions on the property. | Land | Improvement |
|---|---|---|---|---|
| 2025 | $4,861 | $448,402 | $249,825 | $198,577 |
| 2024 | $4,861 | $439,611 | $244,927 | $194,684 |
| 2023 | $4,804 | $430,992 | $240,125 | $190,867 |
| 2022 | $4,727 | $422,542 | $235,417 | $187,125 |
| 2021 | $4,638 | $414,257 | $230,801 | $183,456 |
| 2020 | $4,625 | $410,010 | $228,435 | $181,575 |
| 2019 | $4,542 | $401,971 | $223,956 | $178,015 |
| 2018 | $4,458 | $394,090 | $219,565 | $174,525 |
| 2017 | $4,368 | $386,363 | $215,260 | $171,103 |
| 2016 | $3,986 | $378,789 | $211,040 | $167,749 |
| 2015 | $3,986 | $373,100 | $207,870 | $165,230 |
| 2014 | $3,890 | $365,793 | $203,799 | $161,994 |
Source: Public Records
Map
Nearby Homes
Your Personal Tour Guide
Ask me questions while you tour the home.