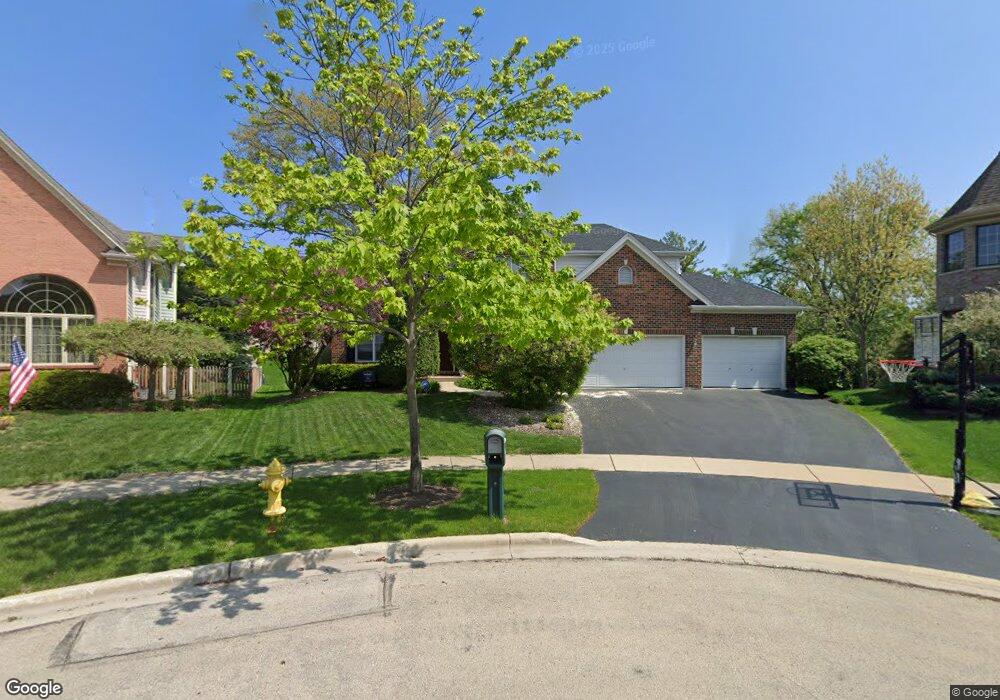
719 Weaver Ct Wheaton, IL 60189
Southeast Wheaton NeighborhoodEstimated Value: $838,728 - $1,039,000
Studio
1
Bath
3,397
Sq Ft
$279/Sq Ft
Est. Value
About This Home
This home is located at 719 Weaver Ct, Wheaton, IL 60189 and is currently estimated at $946,432, approximately $278 per square foot. 719 Weaver Ct is a home located in DuPage County with nearby schools including Lincoln Elementary School, Edison Middle School, and Wheaton Warrenville South High School.
Ownership History
Date
Name
Owned For
Owner Type
Purchase Details
Closed on
Nov 24, 2015
Sold by
Haywood Frank and Haywood Catherine
Bought by
Frank M Haywood Declaration Of Trust
Current Estimated Value
Home Financials for this Owner
Home Financials are based on the most recent Mortgage that was taken out on this home.
Original Mortgage
$515,200
Outstanding Balance
$413,035
Interest Rate
4.37%
Mortgage Type
New Conventional
Estimated Equity
$533,397
Purchase Details
Closed on
Nov 17, 2003
Sold by
Haywood Frank M and Haywood Catherine
Bought by
Murphy Haywood Catherine and Haywood Frank M
Purchase Details
Closed on
Apr 12, 2002
Sold by
West Suburban Bank
Bought by
Haywood Frank and Haywood Catherine
Home Financials for this Owner
Home Financials are based on the most recent Mortgage that was taken out on this home.
Original Mortgage
$458,400
Interest Rate
7.18%
Create a Home Valuation Report for This Property
The Home Valuation Report is an in-depth analysis detailing your home's value as well as a comparison with similar homes in the area
Home Values in the Area
Average Home Value in this Area
Purchase History
| Date | Buyer | Sale Price | Title Company |
|---|---|---|---|
| Frank M Haywood Declaration Of Trust | -- | Prairie Title | |
| Murphy Haywood Catherine | -- | -- | |
| Haywood Frank | $573,000 | -- |
Source: Public Records
Mortgage History
| Date | Status | Borrower | Loan Amount |
|---|---|---|---|
| Open | Frank M Haywood Declaration Of Trust | $515,200 | |
| Closed | Haywood Frank | $458,400 |
Source: Public Records
Tax History
| Year | Tax Paid | Tax Assessment Tax Assessment Total Assessment is a certain percentage of the fair market value that is determined by local assessors to be the total taxable value of land and additions on the property. | Land | Improvement |
|---|---|---|---|---|
| 2024 | $17,452 | $278,781 | $54,744 | $224,037 |
| 2023 | $16,801 | $256,610 | $50,390 | $206,220 |
| 2022 | $16,379 | $242,510 | $47,620 | $194,890 |
| 2021 | $16,332 | $236,760 | $46,490 | $190,270 |
| 2020 | $16,284 | $234,560 | $46,060 | $188,500 |
| 2019 | $15,920 | $228,370 | $44,840 | $183,530 |
| 2018 | $16,205 | $229,740 | $42,250 | $187,490 |
| 2017 | $15,976 | $221,260 | $40,690 | $180,570 |
| 2016 | $15,777 | $212,420 | $39,060 | $173,360 |
| 2015 | $15,673 | $202,650 | $37,260 | $165,390 |
| 2014 | $15,423 | $196,210 | $30,620 | $165,590 |
| 2013 | $15,025 | $196,800 | $30,710 | $166,090 |
Source: Public Records
Map
Nearby Homes
- 1019 Pershing Ave
- 510 S President St
- 715 S Naperville Rd
- 1315 Underwood Terrace
- 1216 E Elm St
- 421 E Willow Ave
- 840 Sheldon Ct Unit B
- 502 S Summit St
- 353 E Liberty Dr
- 1026 Briarcliffe Blvd
- 1000 S Lorraine Rd Unit 214
- 213 S Summit St
- 1601 Castbourne Ct
- 1344 S Lorraine Rd Unit C
- 1129 Rhodes Ct
- 1581 Groton Ln
- 570 Riva Ct
- 522 S West St
- 1678 Groton Ct
- 312 E Lincoln Ave
- 723 Weaver Ct
- 715 Weaver Ct
- 714 Pershing Ave
- 716 Pershing Ave
- 712 Pershing Ave
- 802 Pershing Ave
- 709 Weaver Ct
- 718 Weaver Ct
- 710 Pershing Ave
- 714 Weaver Ct
- 710 Weaver Ct
- 706 Weaver Ct
- 805 E Elm St
- 713 Pershing Ave
- 727 Pershing Ave
- 628 Pershing Ave
- 717 Pershing Ave
- 717 E Elm St
- 725 E Elm St
- 696 Weaver Ct
Your Personal Tour Guide
Ask me questions while you tour the home.