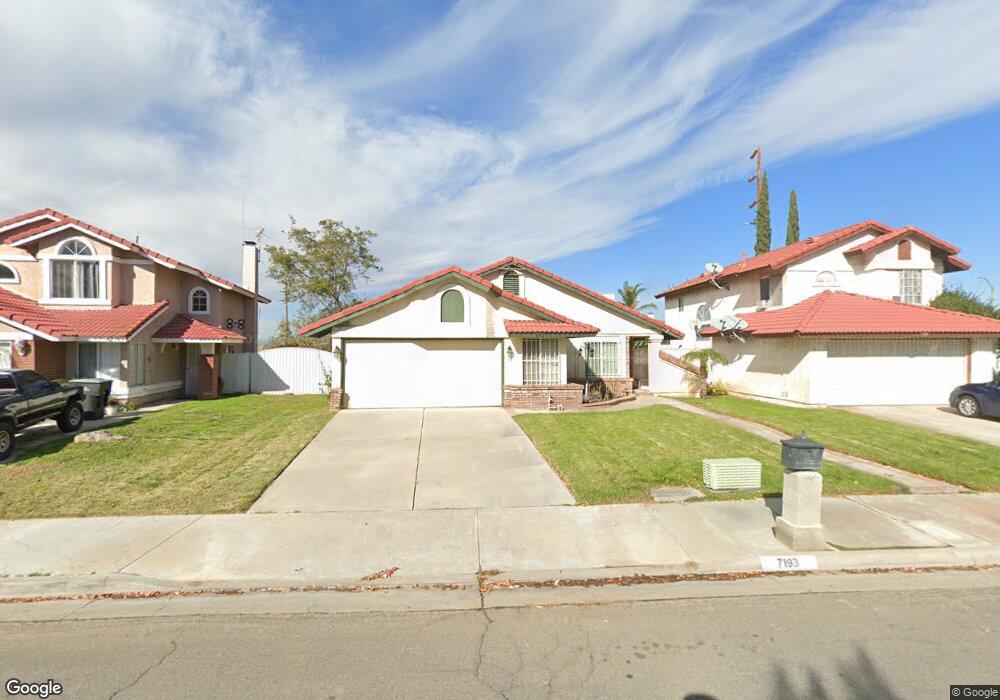
7193 Rutland Ave Riverside, CA 92503
Arlanza NeighborhoodEstimated Value: $560,000 - $576,000
3
Beds
2
Baths
1,130
Sq Ft
$502/Sq Ft
Est. Value
About This Home
This home is located at 7193 Rutland Ave, Riverside, CA 92503 and is currently estimated at $567,269, approximately $502 per square foot. 7193 Rutland Ave is a home located in Riverside County with nearby schools including Terrace Elementary School, Loma Vista Middle School, and Norte Vista High School.
Ownership History
Date
Name
Owned For
Owner Type
Purchase Details
Closed on
May 18, 2022
Sold by
Debra E Blackmon Trust
Bought by
Blackmon Debra E
Current Estimated Value
Home Financials for this Owner
Home Financials are based on the most recent Mortgage that was taken out on this home.
Original Mortgage
$181,500
Outstanding Balance
$172,498
Interest Rate
5.3%
Estimated Equity
$394,771
Purchase Details
Closed on
Apr 27, 2015
Sold by
Blackmon Debra E
Bought by
Debra E Blackmon Trust
Purchase Details
Closed on
Aug 10, 2006
Sold by
Lucas James Edward
Bought by
Lucas James Edward and Blackmon Lucas La Shawn
Purchase Details
Closed on
Oct 12, 1999
Sold by
Blackmon Debra E
Bought by
Blackmon Debra E
Home Financials for this Owner
Home Financials are based on the most recent Mortgage that was taken out on this home.
Original Mortgage
$88,800
Interest Rate
7.86%
Create a Home Valuation Report for This Property
The Home Valuation Report is an in-depth analysis detailing your home's value as well as a comparison with similar homes in the area
Home Values in the Area
Average Home Value in this Area
Purchase History
| Date | Buyer | Sale Price | Title Company |
|---|---|---|---|
| Blackmon Debra E | -- | None Listed On Document | |
| Debra E Blackmon Trust | -- | None Available | |
| Lucas James Edward | -- | Accommodation | |
| Blackmon Debra E | -- | Orange Coast Title |
Source: Public Records
Mortgage History
| Date | Status | Borrower | Loan Amount |
|---|---|---|---|
| Open | Blackmon Debra E | $181,500 | |
| Previous Owner | Blackmon Debra E | $88,800 |
Source: Public Records
Tax History Compared to Growth
Tax History
| Year | Tax Paid | Tax Assessment Tax Assessment Total Assessment is a certain percentage of the fair market value that is determined by local assessors to be the total taxable value of land and additions on the property. | Land | Improvement |
|---|---|---|---|---|
| 2025 | $2,332 | $198,345 | $75,034 | $123,311 |
| 2023 | $2,332 | $190,645 | $72,121 | $118,524 |
| 2022 | $2,157 | $186,907 | $70,707 | $116,200 |
| 2021 | $3,693 | $183,243 | $69,321 | $113,922 |
| 2020 | $3,613 | $181,365 | $68,611 | $112,754 |
| 2019 | $3,585 | $177,810 | $67,266 | $110,544 |
| 2018 | $3,550 | $174,325 | $65,949 | $108,376 |
| 2017 | $3,492 | $170,907 | $64,656 | $106,251 |
| 2016 | $3,458 | $167,557 | $63,389 | $104,168 |
| 2015 | $3,437 | $165,042 | $62,438 | $102,604 |
| 2014 | $3,429 | $161,812 | $61,216 | $100,596 |
Source: Public Records
Map
Nearby Homes
- 7142 Rutland Ave
- 7167 Crest Ave
- 9595 Altadena Dr
- 7024 Crest Ave
- 9820 Mandalay Ct
- 7031 Pasadena Place
- 6789 Green Ave
- 7193 Idyllwild Ln
- 8564 Peachwillow Ct
- 8492 Peachwillow Ct
- 10201 Oxbow Loop
- 7120 Idyllwild Ln
- 8551 Peachwillow Ct
- 8539 Peachwillow Ct
- 6692 Adair Ave
- 8503 Peachwillow Ct
- 10288 Runnel Ln
- 10060 Hillsborough Ln
- 8346 Woodrose St
- 8265 Perada St
- 7189 Rutland Ave
- 7197 Rutland Ave
- 7227 Bradford St
- 7185 Rutland Ave
- 7181 Rutland Ave
- 7190 Rutland Ave
- 7234 Bradford St
- 7194 Rutland Ave
- 7195 Bradford St
- 7180 Rutland Ave
- 7177 Rutland Ave
- 7191 Bradford St
- 7172 Rutland Ave
- 7173 Rutland Ave
- 7196 Bradford St
- 8992 Rossini Ct
- 8986 Rossini Ct
- 7187 Bradford St
- 7166 Rutland Ave
- 7169 Rutland Ave