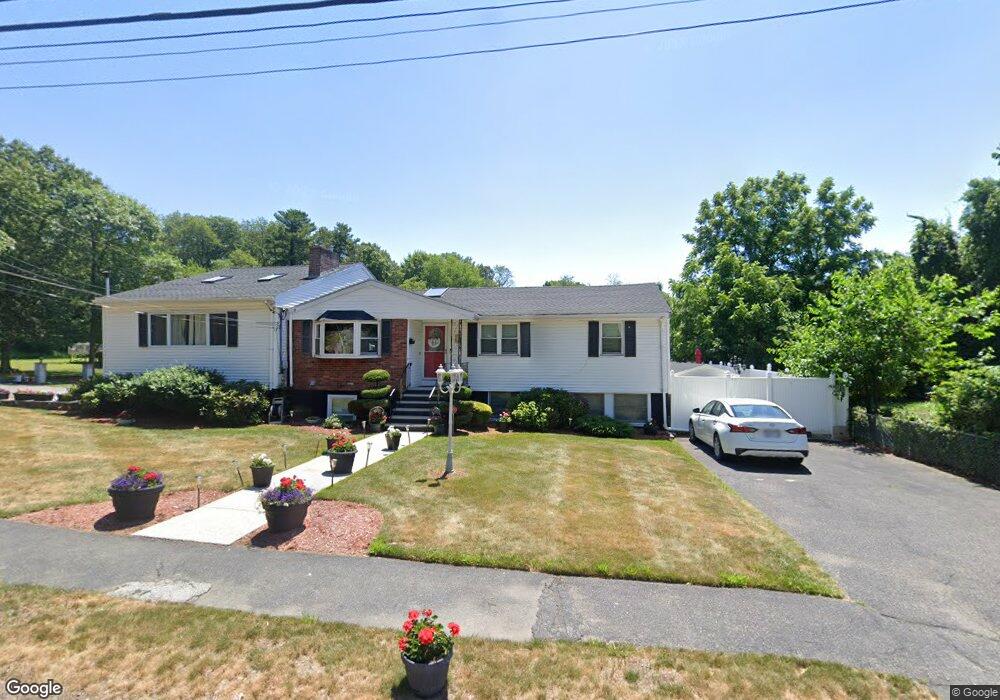
72 Elm St Saugus, MA 01906
Lynnhurst NeighborhoodEstimated Value: $752,599 - $807,000
3
Beds
2
Baths
2,051
Sq Ft
$381/Sq Ft
Est. Value
About This Home
This home is located at 72 Elm St, Saugus, MA 01906 and is currently estimated at $780,650, approximately $380 per square foot. 72 Elm St is a home located in Essex County with nearby schools including Saugus High School, Pioneer Charter School Of Science II, and Sacred Heart School.
Ownership History
Date
Name
Owned For
Owner Type
Purchase Details
Closed on
Dec 11, 2024
Sold by
Doherty Daniel J and Doherty Lillian
Bought by
Doherty Ft and Doherty
Current Estimated Value
Purchase Details
Closed on
Oct 17, 2023
Sold by
Doherty Fat and Doherty D
Bought by
Doherty Daniel J and Doherty Lilian
Purchase Details
Closed on
Jul 14, 2022
Sold by
Doherty Daniel J and Doherty Lillian
Bought by
Doherty Ft and Doherty
Purchase Details
Closed on
Jul 28, 1988
Sold by
Venezia Charles S
Bought by
Doherty Daniel J
Home Financials for this Owner
Home Financials are based on the most recent Mortgage that was taken out on this home.
Original Mortgage
$125,000
Interest Rate
10.39%
Mortgage Type
Purchase Money Mortgage
Create a Home Valuation Report for This Property
The Home Valuation Report is an in-depth analysis detailing your home's value as well as a comparison with similar homes in the area
Home Values in the Area
Average Home Value in this Area
Purchase History
| Date | Buyer | Sale Price | Title Company |
|---|---|---|---|
| Doherty Ft | -- | None Available | |
| Doherty Daniel J | -- | None Available | |
| Doherty Daniel J | -- | None Available | |
| Doherty Ft | -- | None Available | |
| Doherty Ft | -- | None Available | |
| Doherty Daniel J | $180,000 | -- |
Source: Public Records
Mortgage History
| Date | Status | Borrower | Loan Amount |
|---|---|---|---|
| Previous Owner | Doherty Daniel J | $125,000 |
Source: Public Records
Tax History Compared to Growth
Tax History
| Year | Tax Paid | Tax Assessment Tax Assessment Total Assessment is a certain percentage of the fair market value that is determined by local assessors to be the total taxable value of land and additions on the property. | Land | Improvement |
|---|---|---|---|---|
| 2025 | $7,272 | $680,900 | $317,100 | $363,800 |
| 2024 | $7,075 | $664,300 | $308,500 | $355,800 |
| 2023 | $6,816 | $605,300 | $269,900 | $335,400 |
| 2022 | $6,485 | $540,000 | $251,100 | $288,900 |
| 2021 | $6,134 | $497,100 | $208,200 | $288,900 |
| 2020 | $5,672 | $475,800 | $197,900 | $277,900 |
| 2019 | $5,553 | $455,900 | $188,500 | $267,400 |
| 2018 | $5,059 | $436,900 | $179,900 | $257,000 |
| 2017 | $4,640 | $385,100 | $171,400 | $213,700 |
| 2016 | $5,081 | $416,500 | $162,700 | $253,800 |
| 2015 | $4,770 | $396,800 | $155,000 | $241,800 |
| 2014 | $4,507 | $388,200 | $155,000 | $233,200 |
Source: Public Records
Map
Nearby Homes
- 15 Appleton St
- 2 Mcintyre Rd
- 38 Appleton St
- 4 Oneil Way
- 10 Summer St
- 7 Nirvana Dr
- 36 Jasper St
- 29 Susan Dr
- 25 Auburn St
- 28 Emory St
- 846 Broadway Unit 40
- 227 Walnut St
- 38 Vine St
- 9 Thomas St Unit 11
- 57 Vine St
- 32 Birch Brook Rd Unit 27
- 32 Birch Brook Rd Unit 16
- 32 Birch Brook Rd Unit 1
- 32 Birch Brook Rd Unit 25
- 32 Birch Brook Rd Unit 22