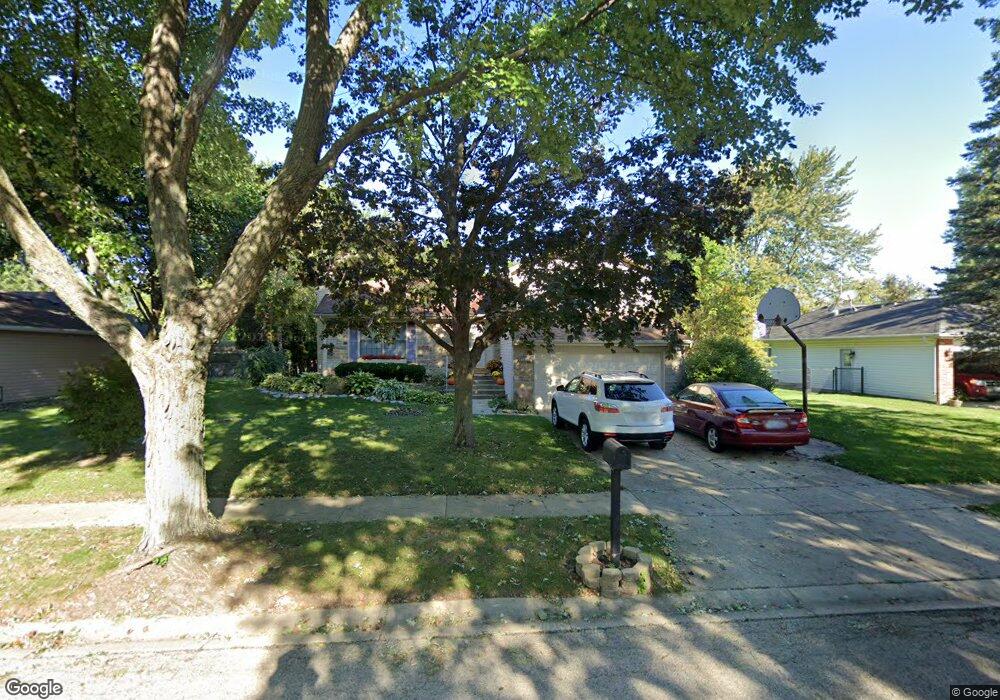
720 Mulberry Ct Algonquin, IL 60102
High Hill Farms NeighborhoodEstimated Value: $372,680 - $378,000
3
Beds
2
Baths
1,816
Sq Ft
$207/Sq Ft
Est. Value
About This Home
This home is located at 720 Mulberry Ct, Algonquin, IL 60102 and is currently estimated at $375,420, approximately $206 per square foot. 720 Mulberry Ct is a home located in McHenry County with nearby schools including Westfield Community School, Kenneth E Neubert Elementary School, and Harry D Jacobs High School.
Ownership History
Date
Name
Owned For
Owner Type
Purchase Details
Closed on
Jun 15, 2007
Sold by
Sapyta Timothy J and Sapyta Karen A
Bought by
Johnson David E and Johnson Connie E
Current Estimated Value
Home Financials for this Owner
Home Financials are based on the most recent Mortgage that was taken out on this home.
Original Mortgage
$269,000
Outstanding Balance
$164,689
Interest Rate
6.2%
Mortgage Type
Unknown
Estimated Equity
$210,731
Purchase Details
Closed on
Nov 27, 1996
Sold by
Tite Gary S and Tite Julie A
Bought by
Sapyta Timothy J and Sapyta Karen A
Home Financials for this Owner
Home Financials are based on the most recent Mortgage that was taken out on this home.
Original Mortgage
$133,800
Interest Rate
7.91%
Purchase Details
Closed on
Nov 26, 1996
Sold by
Stanek Kevin J and Stanek Darren E
Bought by
Preglar Brian D
Home Financials for this Owner
Home Financials are based on the most recent Mortgage that was taken out on this home.
Original Mortgage
$133,800
Interest Rate
7.91%
Create a Home Valuation Report for This Property
The Home Valuation Report is an in-depth analysis detailing your home's value as well as a comparison with similar homes in the area
Home Values in the Area
Average Home Value in this Area
Purchase History
| Date | Buyer | Sale Price | Title Company |
|---|---|---|---|
| Johnson David E | $269,000 | Chicago Title Insurance Co | |
| Sapyta Timothy J | $157,500 | Attorneys Natl Title Network | |
| Preglar Brian D | $127,000 | Chicago Title Insurance Co |
Source: Public Records
Mortgage History
| Date | Status | Borrower | Loan Amount |
|---|---|---|---|
| Open | Johnson David E | $269,000 | |
| Previous Owner | Sapyta Timothy J | $133,800 | |
| Previous Owner | Preglar Brian D | $126,900 |
Source: Public Records
Tax History
| Year | Tax Paid | Tax Assessment Tax Assessment Total Assessment is a certain percentage of the fair market value that is determined by local assessors to be the total taxable value of land and additions on the property. | Land | Improvement |
|---|---|---|---|---|
| 2024 | $8,128 | $103,898 | $21,591 | $82,307 |
| 2023 | $7,779 | $92,923 | $19,310 | $73,613 |
| 2022 | $6,957 | $81,123 | $21,044 | $60,079 |
| 2021 | $6,174 | $75,576 | $19,605 | $55,971 |
| 2020 | $6,007 | $72,901 | $18,911 | $53,990 |
| 2019 | $5,856 | $69,775 | $18,100 | $51,675 |
| 2018 | $5,572 | $64,458 | $16,721 | $47,737 |
| 2017 | $5,449 | $60,723 | $15,752 | $44,971 |
| 2016 | $5,358 | $56,953 | $14,774 | $42,179 |
| 2013 | -- | $57,402 | $13,783 | $43,619 |
Source: Public Records
Map
Nearby Homes
- 730 Chestnut Ct
- 615 Harper Dr
- 21 Division St
- 407 La Fox River Dr
- 1 N Hubbard St
- SWC Talaga and Algonquin Rd
- 13 Brian Ct
- Lot #3-5 Hayes Rd
- 909 Roger St
- 0 River Dr N Unit MRD12473279
- 700 Fairfield Ln
- 1431 Essex St
- 1033 Interloch Ct Unit 32
- 720 Ash St
- 1002 Interloch Ct Unit 152
- 966 Mesa Dr
- 308 Rustic Ln
- 935 Viewpoint Dr
- 1820 Crofton Dr
- 1105 Spring Hill Dr
- 710 Mulberry Ct
- 730 Mulberry Ct
- 731 Orchard Ct
- 721 Orchard Ct
- 711 Orchard Ct
- 740 Mulberry Ct
- 725 Mulberry Ct
- 700 Mulberry Ct Unit 1
- 715 Mulberry Ct
- 560 Forest Cir
- 735 Mulberry Ct
- 705 Mulberry Ct
- 701 Orchard Ct
- 550 Forest Cir
- 750 Mulberry Ct
- 732 Orchard Ct
- 745 Mulberry Ct
- 722 Orchard Ct Unit 1
- 712 Evergreen Ct
- 722 Evergreen Ct
Your Personal Tour Guide
Ask me questions while you tour the home.