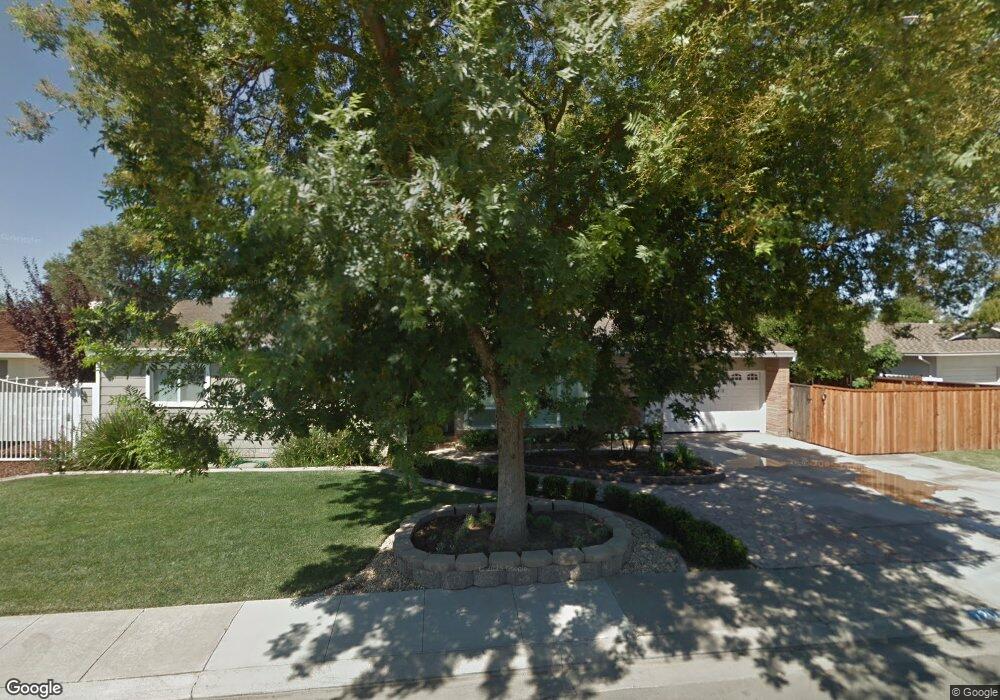
720 N 3rd St Patterson, CA 95363
Estimated Value: $414,000 - $497,000
3
Beds
2
Baths
1,470
Sq Ft
$301/Sq Ft
Est. Value
About This Home
This home is located at 720 N 3rd St, Patterson, CA 95363 and is currently estimated at $443,054, approximately $301 per square foot. 720 N 3rd St is a home located in Stanislaus County with nearby schools including Northmead Elementary School, Creekside Middle School, and Patterson High School.
Ownership History
Date
Name
Owned For
Owner Type
Purchase Details
Closed on
Aug 21, 2012
Sold by
West Ronald B and West Jennifer S
Bought by
West Ronald Brent and West Jenifer Suzanne
Current Estimated Value
Purchase Details
Closed on
Apr 18, 2011
Sold by
Federal Home Loan Mortgage Corporation
Bought by
West Ronald B and West Jennifer S
Purchase Details
Closed on
Aug 20, 2010
Sold by
Polyzos John A and Polyzos Justina Nanette
Bought by
Federal Home Loan Mortgage Corporation
Purchase Details
Closed on
Jun 13, 2000
Sold by
Azevedo Gary T and Azevedo Teresa S
Bought by
Polyzos John A and Polyzos Justina Nanette
Home Financials for this Owner
Home Financials are based on the most recent Mortgage that was taken out on this home.
Original Mortgage
$163,770
Interest Rate
8.2%
Mortgage Type
VA
Create a Home Valuation Report for This Property
The Home Valuation Report is an in-depth analysis detailing your home's value as well as a comparison with similar homes in the area
Home Values in the Area
Average Home Value in this Area
Purchase History
| Date | Buyer | Sale Price | Title Company |
|---|---|---|---|
| West Ronald Brent | -- | None Available | |
| West Ronald B | $150,500 | Ticor Title Riverside | |
| Federal Home Loan Mortgage Corporation | $109,000 | Accommodation | |
| Polyzos John A | $159,000 | Fidelity National Title Co |
Source: Public Records
Mortgage History
| Date | Status | Borrower | Loan Amount |
|---|---|---|---|
| Previous Owner | Polyzos John A | $163,770 |
Source: Public Records
Tax History
| Year | Tax Paid | Tax Assessment Tax Assessment Total Assessment is a certain percentage of the fair market value that is determined by local assessors to be the total taxable value of land and additions on the property. | Land | Improvement |
|---|---|---|---|---|
| 2025 | $2,402 | $213,408 | $51,240 | $162,168 |
| 2024 | $2,394 | $209,225 | $50,236 | $158,989 |
| 2023 | $2,338 | $205,123 | $49,251 | $155,872 |
| 2022 | $2,203 | $201,102 | $48,286 | $152,816 |
| 2021 | $2,170 | $197,160 | $47,340 | $149,820 |
| 2020 | $2,171 | $195,139 | $46,855 | $148,284 |
| 2019 | $2,136 | $191,314 | $45,937 | $145,377 |
| 2018 | $2,031 | $187,564 | $45,037 | $142,527 |
| 2017 | $1,987 | $183,887 | $44,154 | $139,733 |
| 2016 | $1,931 | $180,283 | $43,289 | $136,994 |
| 2015 | $1,902 | $177,576 | $42,639 | $134,937 |
| 2014 | $1,835 | $172,137 | $41,804 | $130,333 |
Source: Public Records
Map
Nearby Homes
- 701 N 3rd St
- 140 Ivy Ave Unit A5
- 140 Ivy Ave Unit 39
- 647 Ward Ave
- 642 Wanzia Ct
- 192 Torvend Way
- 216 Barros St
- 14125 Ward Ave
- 608 Somerset Way
- 801 Chatham Ln
- 809 Chatham Ln
- 1430 Walnut Ave
- 813 Chatham Ln
- 817 Chatham Ln
- 821 Chatham Ln
- 829 Chatham Ln
- 833 Chatham Ln
- 800 Chatham Ln
- 804 Chatham Ln
- 812 Chatham Ln
Your Personal Tour Guide
Ask me questions while you tour the home.