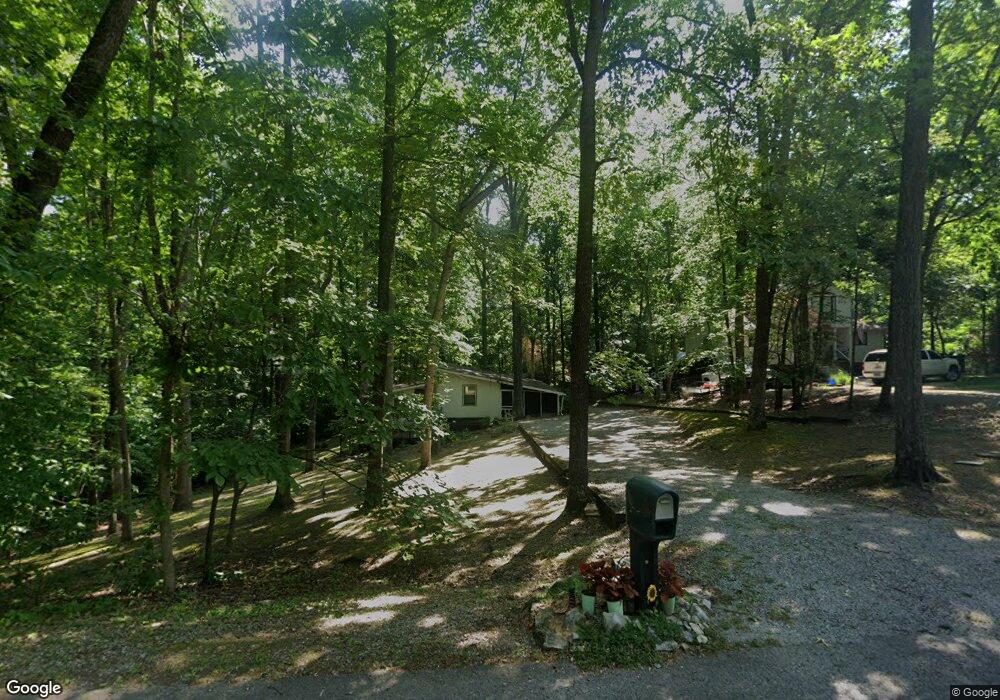
7201 Sutton Place Fairview, TN 37062
Estimated Value: $298,985 - $385,000
Studio
2
Baths
1,316
Sq Ft
$262/Sq Ft
Est. Value
About This Home
This home is located at 7201 Sutton Place, Fairview, TN 37062 and is currently estimated at $344,996, approximately $262 per square foot. 7201 Sutton Place is a home located in Williamson County with nearby schools including Fairview Elementary School, Fairview Middle School, and Fairview High School.
Ownership History
Date
Name
Owned For
Owner Type
Purchase Details
Closed on
Jan 31, 2005
Sold by
Newsome Toby S
Bought by
Black Linda
Current Estimated Value
Home Financials for this Owner
Home Financials are based on the most recent Mortgage that was taken out on this home.
Original Mortgage
$105,300
Outstanding Balance
$52,848
Interest Rate
5.66%
Mortgage Type
Purchase Money Mortgage
Estimated Equity
$292,148
Purchase Details
Closed on
May 29, 2002
Sold by
Sands James Troy and Sands Tamara
Bought by
Newsome Toby S
Home Financials for this Owner
Home Financials are based on the most recent Mortgage that was taken out on this home.
Original Mortgage
$100,350
Interest Rate
6.92%
Purchase Details
Closed on
May 15, 2001
Sold by
Mclean Shawn F
Bought by
Sands James Troy and Sands Tamara
Home Financials for this Owner
Home Financials are based on the most recent Mortgage that was taken out on this home.
Original Mortgage
$71,920
Interest Rate
6.98%
Purchase Details
Closed on
Apr 25, 1994
Sold by
Estes Barry R
Bought by
Mclean Shawn F
Create a Home Valuation Report for This Property
The Home Valuation Report is an in-depth analysis detailing your home's value as well as a comparison with similar homes in the area
Home Values in the Area
Average Home Value in this Area
Purchase History
| Date | Buyer | Sale Price | Title Company |
|---|---|---|---|
| Black Linda | $117,000 | First American Title Ins Co | |
| Newsome Toby S | $103,500 | -- | |
| Sands James Troy | $89,900 | -- | |
| Mclean Shawn F | $74,500 | -- |
Source: Public Records
Mortgage History
| Date | Status | Borrower | Loan Amount |
|---|---|---|---|
| Open | Black Linda | $105,300 | |
| Previous Owner | Newsome Toby S | $100,350 | |
| Previous Owner | Sands James Troy | $71,920 |
Source: Public Records
Tax History
| Year | Tax Paid | Tax Assessment Tax Assessment Total Assessment is a certain percentage of the fair market value that is determined by local assessors to be the total taxable value of land and additions on the property. | Land | Improvement |
|---|---|---|---|---|
| 2025 | $1,333 | $76,275 | $22,500 | $53,775 |
| 2024 | $1,333 | $48,375 | $15,000 | $33,375 |
| 2023 | $1,333 | $48,375 | $15,000 | $33,375 |
| 2022 | $1,333 | $48,375 | $15,000 | $33,375 |
| 2021 | $909 | $48,375 | $15,000 | $33,375 |
| 2020 | $755 | $34,000 | $7,500 | $26,500 |
| 2019 | $755 | $34,000 | $7,500 | $26,500 |
| 2018 | $731 | $34,000 | $7,500 | $26,500 |
| 2017 | $724 | $34,000 | $7,500 | $26,500 |
| 2016 | $714 | $34,000 | $7,500 | $26,500 |
Source: Public Records
Map
Nearby Homes
- 7722 Chester Rd
- 7116 Kyles Creek Dr
- 7122 Meadow View Dr
- 7209 White Oak Dr
- 9013 Ada Way
- 9021 Ada Way
- 7016 Sully Ct
- 7108 White Oak Dr
- 997 Wiseman Farm Rd
- 7163 Kyles Creek Dr
- 1009 Wiseman Farm Rd
- 7017 Sully Ct
- 7019 Sully Ct
- 7504 Hunter York Ct
- 1006 Wiseman Farm Rd
- 4006 Brazelton Way
- 7021 Sully Ct
- 2003 Case Way
- 6004 Venable Ct
- 7211 Rye Ct
- 7203 Sutton Place
- 0 Sutton Place
- 7205 Sutton Place
- 7123 Sutton Place
- 7202 Sutton Place
- 7104 Robinson Dr
- 7207 Sutton Place
- 7710 Chester Rd
- 7206 Sutton Place
- 7121 Sutton Place
- 7706 Chester Rd
- 7124 Sutton Place
- 7702 Chester Rd
- 7209 Sutton Place
- 7210 Sutton Place
- 7105 Robinson Dr
- 7122 Sutton Place
- 7716 Chester Rd
- 7108 Robinson Dr
- 7212 Sutton Place
Your Personal Tour Guide
Ask me questions while you tour the home.