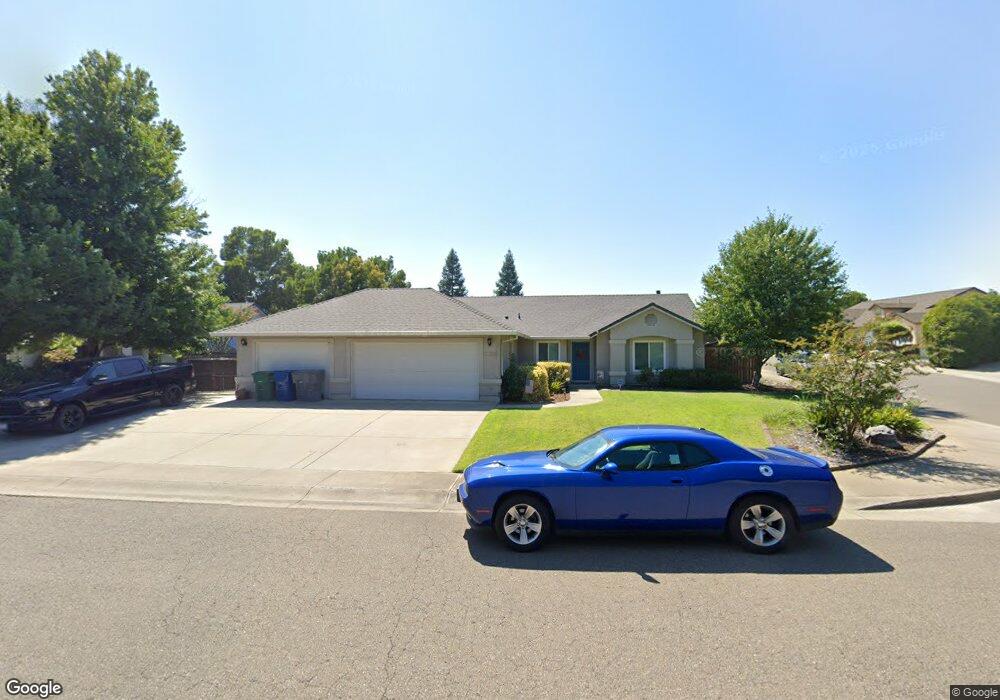
7206 Platinum Way Redding, CA 96001
Girvan NeighborhoodEstimated Value: $359,000 - $414,000
3
Beds
2
Baths
1,488
Sq Ft
$262/Sq Ft
Est. Value
About This Home
This home is located at 7206 Platinum Way, Redding, CA 96001 and is currently estimated at $389,906, approximately $262 per square foot. 7206 Platinum Way is a home located in Shasta County with nearby schools including Bonny View Elementary School, Sequoia Middle School, and Shasta High School.
Ownership History
Date
Name
Owned For
Owner Type
Purchase Details
Closed on
Mar 27, 2021
Sold by
Stulir Ronald F and Stulir Sara J
Bought by
Stulir Ronald F and Stulir Sara J
Current Estimated Value
Home Financials for this Owner
Home Financials are based on the most recent Mortgage that was taken out on this home.
Original Mortgage
$301,600
Outstanding Balance
$272,308
Interest Rate
3%
Mortgage Type
New Conventional
Estimated Equity
$117,598
Purchase Details
Closed on
Nov 2, 2005
Sold by
Stulir Ronald F and Stulir Sara J
Bought by
Stulir Ronald F and Stulir Sara J
Purchase Details
Closed on
May 10, 2002
Sold by
Allen Jeb and Tsai Sue
Bought by
Stulir Ronald F and Stulir Sara J
Home Financials for this Owner
Home Financials are based on the most recent Mortgage that was taken out on this home.
Original Mortgage
$164,450
Interest Rate
7.13%
Create a Home Valuation Report for This Property
The Home Valuation Report is an in-depth analysis detailing your home's value as well as a comparison with similar homes in the area
Home Values in the Area
Average Home Value in this Area
Purchase History
| Date | Buyer | Sale Price | Title Company |
|---|---|---|---|
| Stulir Ronald F | -- | None Available | |
| Stulir Ronald F | -- | Amrock Inc | |
| Stulir Ronald F | -- | -- | |
| Stulir Ronald F | $158,500 | Placer Title Company |
Source: Public Records
Mortgage History
| Date | Status | Borrower | Loan Amount |
|---|---|---|---|
| Open | Stulir Ronald F | $301,600 | |
| Closed | Stulir Ronald F | $164,450 |
Source: Public Records
Tax History
| Year | Tax Paid | Tax Assessment Tax Assessment Total Assessment is a certain percentage of the fair market value that is determined by local assessors to be the total taxable value of land and additions on the property. | Land | Improvement |
|---|---|---|---|---|
| 2025 | $2,591 | $256,536 | $56,123 | $200,413 |
| 2024 | $2,550 | $251,507 | $55,023 | $196,484 |
| 2023 | $2,550 | $246,577 | $53,945 | $192,632 |
| 2022 | $2,505 | $241,743 | $52,888 | $188,855 |
| 2021 | $2,492 | $237,003 | $51,851 | $185,152 |
| 2020 | $2,524 | $234,574 | $51,320 | $183,254 |
| 2019 | $2,395 | $229,975 | $50,314 | $179,661 |
| 2018 | $2,415 | $225,467 | $49,328 | $176,139 |
| 2017 | $2,401 | $221,047 | $48,361 | $172,686 |
| 2016 | $2,323 | $216,713 | $47,413 | $169,300 |
| 2015 | $2,292 | $213,458 | $46,701 | $166,757 |
| 2014 | $2,276 | $209,278 | $45,787 | $163,491 |
Source: Public Records
Map
Nearby Homes
- 7253 Legacy
- 7420 Platinum Way
- 7022 Marvin Trail
- 6871 Hemlock St
- 7575 Pit Rd
- 7060 Pit Rd
- 6955 Yvonne Ct
- 7728 Pit Rd
- 3182 Island Dr
- 6725 Reflection St
- 7035 Riverside Dr
- 6958 Riverside Dr
- 0 Waverly Manor
- 6681 Riverside Dr
- 2890 Balaton Ave
- 2850 Balaton Ave
- 6733 El Camino Dr
- 6551 El Camino Dr
- 8641 Redbank Rd
- 6624 Southgate Dr
- 2750 Pendant Way
- 7220 Platinum Way
- 2677 Pendant Way
- 7234 Platinum Way
- 2678 Pendant Way
- 2692 Pendant Way
- 2659 Pendant Way
- 2664 Pendant Way
- 7248 Platinum Way
- 2650 Pendant Way
- 7247 Platinum Way
- 2636 Pendant Way
- 7262 Platinum Way
- 2641 Pendant Way
- 2831 Girvan Rd
- 7263 Platinum Way
- 2841 Girvan Rd
- 2821 Girvan Rd
- 2817 Girvan Rd
- 2622 Pendant Way
Your Personal Tour Guide
Ask me questions while you tour the home.