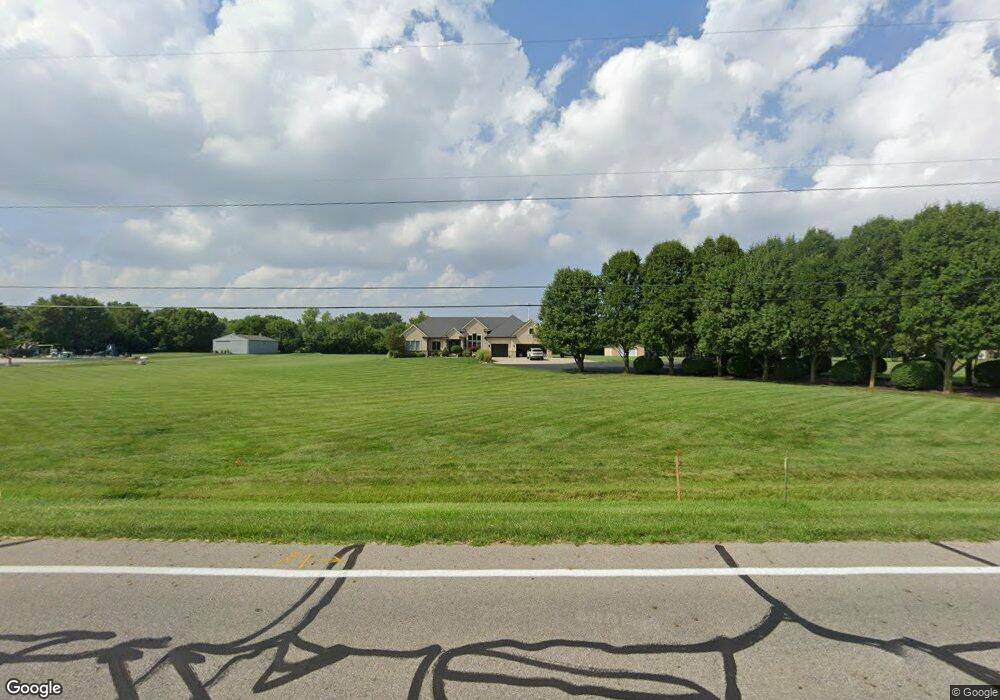
7208 Feder Rd Galloway, OH 43119
Brown NeighborhoodEstimated Value: $887,000 - $1,148,000
4
Beds
3
Baths
5,300
Sq Ft
$193/Sq Ft
Est. Value
About This Home
This home is located at 7208 Feder Rd, Galloway, OH 43119 and is currently estimated at $1,020,432, approximately $192 per square foot. 7208 Feder Rd is a home located in Franklin County with nearby schools including Brown Elementary School, Hilliard Station Sixth Grade Elementary School, and Hilliard Memorial Middle School.
Ownership History
Date
Name
Owned For
Owner Type
Purchase Details
Closed on
May 15, 2003
Sold by
Jones Teresa R and Caldwell Teresa R
Bought by
Culbertson Timothy E and Culbertson Mary Beth
Current Estimated Value
Purchase Details
Closed on
Jun 21, 2002
Sold by
Caldwell Rodney
Bought by
Jones Teresa R
Purchase Details
Closed on
Jun 13, 2001
Sold by
Fiest Farrell Steven C and Fiest Sharon K
Bought by
Caldwell Rodney and Caldwell Teresa
Home Financials for this Owner
Home Financials are based on the most recent Mortgage that was taken out on this home.
Original Mortgage
$477,000
Interest Rate
9.87%
Purchase Details
Closed on
Aug 28, 1997
Sold by
Lovett Lukas J K
Bought by
Farrell Steven C and Fiest Sharon K
Home Financials for this Owner
Home Financials are based on the most recent Mortgage that was taken out on this home.
Original Mortgage
$41,200
Interest Rate
7.63%
Create a Home Valuation Report for This Property
The Home Valuation Report is an in-depth analysis detailing your home's value as well as a comparison with similar homes in the area
Home Values in the Area
Average Home Value in this Area
Purchase History
| Date | Buyer | Sale Price | Title Company |
|---|---|---|---|
| Culbertson Timothy E | $520,000 | Title First Agency Inc | |
| Jones Teresa R | -- | -- | |
| Caldwell Rodney | $530,000 | Warranty Title | |
| Farrell Steven C | $51,500 | -- |
Source: Public Records
Mortgage History
| Date | Status | Borrower | Loan Amount |
|---|---|---|---|
| Previous Owner | Caldwell Rodney | $477,000 | |
| Previous Owner | Farrell Steven C | $41,200 |
Source: Public Records
Tax History Compared to Growth
Tax History
| Year | Tax Paid | Tax Assessment Tax Assessment Total Assessment is a certain percentage of the fair market value that is determined by local assessors to be the total taxable value of land and additions on the property. | Land | Improvement |
|---|---|---|---|---|
| 2024 | $17,871 | $291,690 | $129,710 | $161,980 |
| 2023 | $15,711 | $291,690 | $129,710 | $161,980 |
| 2022 | $16,385 | $241,820 | $104,440 | $137,380 |
| 2021 | $16,393 | $241,820 | $104,440 | $137,380 |
| 2020 | $16,406 | $241,820 | $104,440 | $137,380 |
| 2019 | $16,650 | $209,900 | $90,790 | $119,110 |
| 2018 | $15,885 | $209,900 | $90,790 | $119,110 |
| 2017 | $16,312 | $209,900 | $90,790 | $119,110 |
| 2016 | $16,019 | $188,030 | $35,810 | $152,220 |
| 2015 | $15,161 | $188,030 | $35,810 | $152,220 |
| 2014 | $15,207 | $188,030 | $35,810 | $152,220 |
| 2013 | $6,973 | $179,060 | $34,090 | $144,970 |
Source: Public Records
Map
Nearby Homes
- 1525 Cole Rd
- 6677 Spicewood Ct
- Tallmadge Townhome (Mid Unit) Plan at Renner Park - Villas at Renner Park
- Portsmouth Plan at Renner Park - Villas at Renner Park
- 1498 Jarry Ave
- 1500 Jarry Ave
- 1539 Crosley Ln
- 6355 Marinelli Dr N
- 6358 Ripken St
- 6354 Ripken St
- 1569 Crosley Ln
- 6352 Ripken St
- 1575 Crosley Ln
- 6350 Ripken St
- 6357 Darby Plains St
- 6296 Marinelli Dr S
- 6294 Marinelli Dr S
- 6332 Rickwood Trail
- 6278 Marinelli Dr S
- 6276 Marinelli Dr S