

SOLD MAY 26, 2016
RENTED JAN 17, 2025
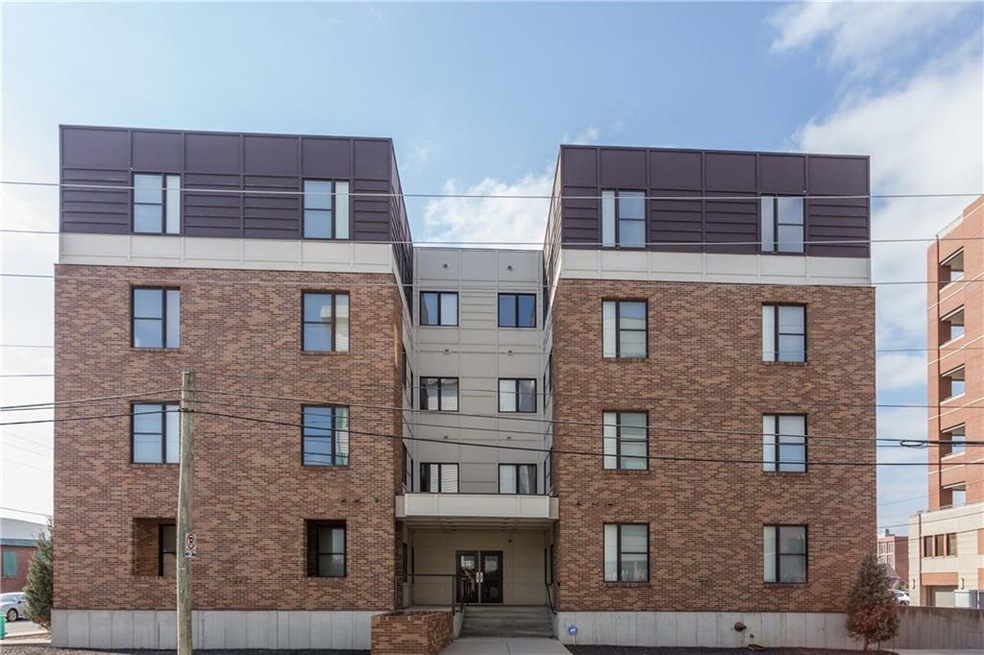
721 E North St Unit 1C Indianapolis, IN 46202
Lockerbie Square Neighborhood
2
Beds
2
Baths
960
Sq Ft
436
Sq Ft Lot
Highlights
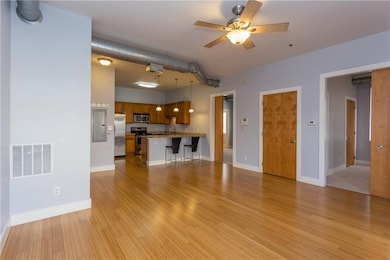
- Vaulted Ceiling
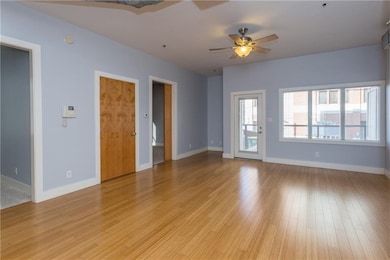
- Balcony
- Woodwork
- Elevator
- Intercom
- 1-Story Property
About This Home
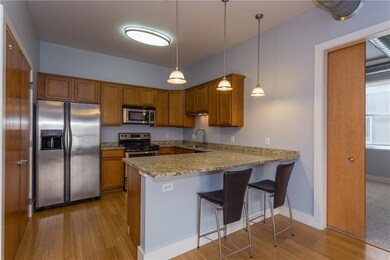
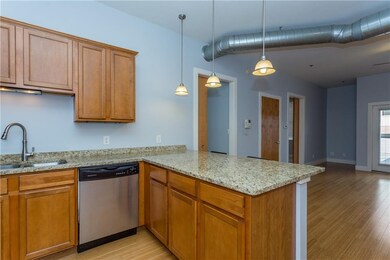
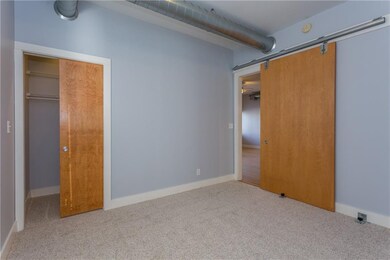
As of June 2018Location-Location-Location! Walk to Mass Ave, Canal, Concerts, Circle of Lights, watch fireworks (from your own balcony). First floor condo; attached, heated garage. Updated kitchen with ss applncs, granite countertops. Master with double sinks; 2nd bedroom with its own bath. New interior paint, carpet; high efficiency front load W/D included. Secure building.
Property Details
Home Type
- Condominium
Est. Annual Taxes
- $3,682
Year Built
- Built in 2007
Parking
- Garage
Home Design
- Brick Exterior Construction
- Concrete Perimeter Foundation
Interior Spaces
- 960 Sq Ft Home
- 1-Story Property
- Woodwork
- Vaulted Ceiling
- Window Screens
- Intercom
Kitchen
- Electric Oven
- Built-In Microwave
- Dishwasher
- Disposal
Bedrooms and Bathrooms
- 2 Bedrooms
- 2 Full Bathrooms
Laundry
- Dryer
- Washer
Additional Features
- Balcony
- Forced Air Heating and Cooling System
Listing and Financial Details
- Assessor Parcel Number 491101122089003101
Community Details
Overview
- Association fees include insurance, ground maintenance, snow removal, trash, sewer
- Spring Street Condominiums Subdivision
- Property managed by Kirkpatrick
Additional Features
- Elevator
- Fire and Smoke Detector
Ownership History
Date
Name
Owned For
Owner Type
Purchase Details
Listed on
Apr 30, 2018
Closed on
Jun 29, 2018
Sold by
Mirman Dana
Bought by
Garber Teresa A
Seller's Agent
Mike Deck
Berkshire Hathaway Home
Buyer's Agent
Michele Schulhof
List Price
$250,000
Sold Price
$255,500
Premium/Discount to List
$5,500
2.2%
Current Estimated Value
Home Financials for this Owner
Home Financials are based on the most recent Mortgage that was taken out on this home.
Estimated Appreciation
$104,131
Avg. Annual Appreciation
3.36%
Original Mortgage
$229,950
Interest Rate
4.5%
Mortgage Type
New Conventional
Purchase Details
Listed on
Mar 24, 2016
Closed on
Apr 13, 2016
Sold by
Ziarek Krzystof and Ziarek Ewa
Bought by
Lyons Dana
Seller's Agent
Liz Hanes
eXp Realty, LLC
Buyer's Agent
Joel Vanags
Berkshire Hathaway Home
List Price
$215,000
Sold Price
$217,500
Premium/Discount to List
$2,500
1.16%
Home Financials for this Owner
Home Financials are based on the most recent Mortgage that was taken out on this home.
Avg. Annual Appreciation
8.01%
Original Mortgage
$206,625
Interest Rate
3.66%
Mortgage Type
New Conventional
Purchase Details
Closed on
Sep 27, 2007
Sold by
Spring Street Llc
Bought by
Ziarek Krzysztof and Ziarek Ewa
Home Financials for this Owner
Home Financials are based on the most recent Mortgage that was taken out on this home.
Original Mortgage
$31,000
Interest Rate
6.66%
Mortgage Type
Purchase Money Mortgage
Similar Homes in Indianapolis, IN
Create a Home Valuation Report for This Property
The Home Valuation Report is an in-depth analysis detailing your home's value as well as a comparison with similar homes in the area
Home Values in the Area
Average Home Value in this Area
Purchase History
| Date | Type | Sale Price | Title Company |
|---|---|---|---|
| Warranty Deed | -- | None Available | |
| Warranty Deed | -- | First American Title | |
| Warranty Deed | -- | None Available |
Source: Public Records
Mortgage History
| Date | Status | Loan Amount | Loan Type |
|---|---|---|---|
| Open | $226,000 | New Conventional | |
| Closed | $229,950 | New Conventional | |
| Previous Owner | $206,625 | New Conventional | |
| Previous Owner | $163,500 | New Conventional | |
| Previous Owner | $31,000 | Purchase Money Mortgage | |
| Previous Owner | $165,600 | New Conventional |
Source: Public Records
Property History
| Date | Event | Price | Change | Sq Ft Price |
|---|---|---|---|---|
| 01/17/2025 01/17/25 | Rented | $1,950 | -2.3% | -- |
| 11/08/2024 11/08/24 | Price Changed | $1,995 | -5.0% | $2 / Sq Ft |
| 10/25/2024 10/25/24 | Price Changed | $2,100 | -4.5% | $2 / Sq Ft |
| 09/24/2024 09/24/24 | For Rent | $2,200 | +15.8% | -- |
| 09/07/2022 09/07/22 | Rented | $1,900 | 0.0% | -- |
| 09/07/2022 09/07/22 | Under Contract | -- | -- | -- |
| 08/20/2022 08/20/22 | Price Changed | $1,900 | -15.6% | $2 / Sq Ft |
| 08/11/2022 08/11/22 | Price Changed | $2,250 | -10.0% | $2 / Sq Ft |
| 08/06/2022 08/06/22 | For Rent | $2,500 | 0.0% | -- |
| 06/29/2018 06/29/18 | Sold | $255,500 | -1.7% | $266 / Sq Ft |
| 04/30/2018 04/30/18 | Pending | -- | -- | -- |
| 04/30/2018 04/30/18 | Price Changed | $260,000 | +4.0% | $271 / Sq Ft |
| 04/30/2018 04/30/18 | For Sale | $250,000 | +14.9% | $260 / Sq Ft |
| 05/26/2016 05/26/16 | Sold | $217,500 | 0.0% | $227 / Sq Ft |
| 03/26/2016 03/26/16 | Off Market | $217,500 | -- | -- |
| 03/23/2016 03/23/16 | For Sale | $215,000 | -- | $224 / Sq Ft |
Source: MIBOR Broker Listing Cooperative®
Tax History Compared to Growth
Tax History
| Year | Tax Paid | Tax Assessment Tax Assessment Total Assessment is a certain percentage of the fair market value that is determined by local assessors to be the total taxable value of land and additions on the property. | Land | Improvement |
|---|---|---|---|---|
| 2024 | $2,759 | $230,100 | $37,300 | $192,800 |
| 2023 | $2,759 | $230,200 | $37,300 | $192,900 |
| 2022 | $2,641 | $219,300 | $37,300 | $182,000 |
| 2021 | $2,931 | $248,500 | $33,900 | $214,600 |
| 2020 | $3,014 | $254,500 | $33,900 | $220,600 |
| 2019 | $3,112 | $257,600 | $33,900 | $223,700 |
| 2018 | $3,143 | $257,800 | $33,900 | $223,900 |
| 2017 | $2,454 | $226,500 | $33,900 | $192,600 |
| 2016 | $2,198 | $207,200 | $33,900 | $173,300 |
| 2014 | $3,682 | $170,300 | $33,900 | $136,400 |
| 2013 | $1,901 | $183,500 | $33,900 | $149,600 |
Source: Public Records
Agents Affiliated with this Home
-
Jenny Laughner
Seller's Agent in 2025
Jenny Laughner
CENTURY 21 Scheetz
(317) 339-6972
240 Total Sales
-
M
Buyer's Agent in 2022
Mark Sprout
@properties
-
Mike Deck
Seller's Agent in 2018
Mike Deck
Berkshire Hathaway Home
(317) 339-2830
708 Total Sales
-
Joel Vanags
Seller Co-Listing Agent in 2018
Joel Vanags
Berkshire Hathaway Home
(317) 408-1298
150 Total Sales
-
M
Buyer's Agent in 2018
Michele Schulhof
-
M
Buyer's Agent in 2018
Michele Doyle
M.S.WOODS REAL ESTATE, LLC
Map
Source: MIBOR Broker Listing Cooperative®
MLS Number: MBR21404269
APN: 49-11-01-122-089.003-101
Disclaimer: Certain information contained herein is derived from information provided by parties other than Homes.com. All information provided is deemed reliable, but is not guaranteed to be accurate and should be independently verified.
![]() Based on information submitted to the MLS GRID. All data is obtained from various sources and may not have been verified by broker or MLS GRID. Supplied Open House Information is subject to change without notice. All information should be independently reviewed and verified for accuracy. Properties may or may not be listed by the office/agent presenting the information. Some IDX listings have been excluded from this website.
Based on information submitted to the MLS GRID. All data is obtained from various sources and may not have been verified by broker or MLS GRID. Supplied Open House Information is subject to change without notice. All information should be independently reviewed and verified for accuracy. Properties may or may not be listed by the office/agent presenting the information. Some IDX listings have been excluded from this website.
Nearby Homes
- 559 Fulton St
- 525 Fynn Place
- 624 E Walnut St Unit 26
- 624 E Walnut St Unit 48
- 630 N College Ave Unit 409
- 630 N College Ave Unit 204
- 630 N College Ave Unit 105
- 630 N College Ave Unit 401
- 611 N Park Ave Unit 104
- 611 N Park Ave Unit 108
- 419 N College Ave
- 610 N Park Ave
- 504 N Park Ave Unit 4
- 531 E North St
- 527 E North St
- 430 N Park Ave Unit 104
- 430 N Park Ave Unit 103
- 749 N Park Ave Unit A
- 558 E Vermont St
- 123 E Michigan St