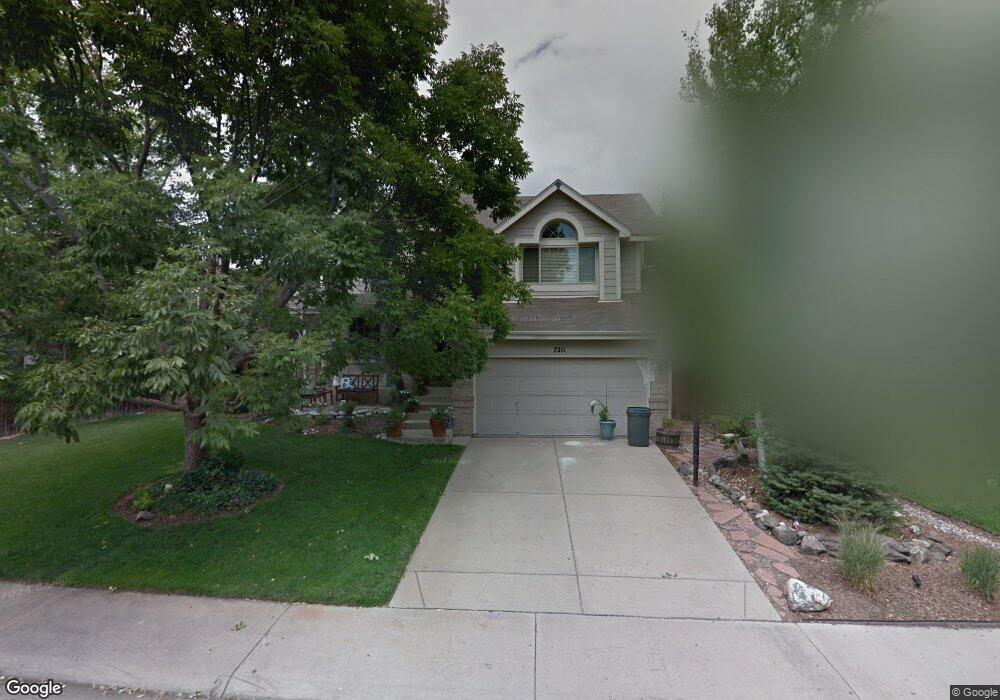
7211 S Pierson St Littleton, CO 80127
Meadows NeighborhoodEstimated Value: $649,147 - $755,000
4
Beds
5
Baths
1,858
Sq Ft
$378/Sq Ft
Est. Value
About This Home
This home is located at 7211 S Pierson St, Littleton, CO 80127 and is currently estimated at $702,287, approximately $377 per square foot. 7211 S Pierson St is a home located in Jefferson County with nearby schools including Ute Meadows Elementary School, Deer Creek Middle School, and Chatfield High School.
Ownership History
Date
Name
Owned For
Owner Type
Purchase Details
Closed on
Mar 31, 2000
Sold by
Gorski Dusty R A Gorski Jennifer L
Bought by
Scott Blake L and Scott Heather C
Current Estimated Value
Home Financials for this Owner
Home Financials are based on the most recent Mortgage that was taken out on this home.
Original Mortgage
$218,400
Outstanding Balance
$75,576
Interest Rate
8.37%
Estimated Equity
$626,711
Purchase Details
Closed on
Mar 28, 1997
Sold by
Koffler Kerry M and Koffler Terri D
Bought by
Gorski Dusty R A and Gorski Jennifer L
Home Financials for this Owner
Home Financials are based on the most recent Mortgage that was taken out on this home.
Original Mortgage
$143,200
Interest Rate
4.95%
Create a Home Valuation Report for This Property
The Home Valuation Report is an in-depth analysis detailing your home's value as well as a comparison with similar homes in the area
Home Values in the Area
Average Home Value in this Area
Purchase History
| Date | Buyer | Sale Price | Title Company |
|---|---|---|---|
| Scott Blake L | $229,900 | -- | |
| Gorski Dusty R A | $179,000 | First American Heritage Titl |
Source: Public Records
Mortgage History
| Date | Status | Borrower | Loan Amount |
|---|---|---|---|
| Open | Scott Blake L | $218,400 | |
| Closed | Gorski Dusty R A | $143,200 |
Source: Public Records
Tax History Compared to Growth
Tax History
| Year | Tax Paid | Tax Assessment Tax Assessment Total Assessment is a certain percentage of the fair market value that is determined by local assessors to be the total taxable value of land and additions on the property. | Land | Improvement |
|---|---|---|---|---|
| 2024 | $3,730 | $34,422 | $11,865 | $22,557 |
| 2023 | $3,730 | $34,422 | $11,865 | $22,557 |
| 2022 | $3,201 | $32,088 | $10,501 | $21,587 |
| 2021 | $3,242 | $33,011 | $10,803 | $22,208 |
| 2020 | $2,808 | $28,657 | $8,418 | $20,239 |
| 2019 | $2,773 | $28,657 | $8,418 | $20,239 |
| 2018 | $2,588 | $25,826 | $8,957 | $16,869 |
| 2017 | $2,362 | $25,826 | $8,957 | $16,869 |
| 2016 | $2,400 | $25,324 | $7,860 | $17,464 |
| 2015 | $2,049 | $25,324 | $7,860 | $17,464 |
| 2014 | $2,049 | $20,277 | $6,809 | $13,468 |
Source: Public Records
Map
Nearby Homes
- 7413 S Quail Cir Unit 1422
- 7413 S Quail Cir Unit 1435
- 11412 W Roxbury Place
- 7493 S Quail Cir Unit 926
- 11434 W Roxbury Dr
- 7433 S Quail Cir Unit 1924
- 7462 S Quail Cir Unit 426
- 7060 S Oak Ct
- 10656 W Rowland Ave
- 10675 W Rowland Ave
- 7339 S Gore Range Rd
- 7369 S Gore Range Rd Unit 208
- 7454 S Alkire St Unit 301
- 7646 S Bear Mountain
- 10371 W Indore Dr
- 7359 S Mount Holy Cross
- 7409 S Alkire St Unit 304
- 11235 San Joaquin Ridge
- 11502 W Cooper Ave
- 11703 Elk Head Range Rd
- 7207 S Pierson St
- 11103 W Fremont Place
- 11113 W Fremont Place
- 11123 W Fremont Place
- 7191 S Pierson St
- 11133 W Fremont Place
- 7187 S Pierson St
- 7210 S Pierson St
- 11143 W Fremont Place
- 7196 S Pierson St
- 7206 S Pierson St
- 7216 S Pierson St
- 7190 S Pierson St
- 7220 S Pierson St
- 7200 S Pierson St
- 11122 W Roxbury Place
- 11114 W Fremont Place
- 11104 W Fremont Place
- 7226 S Pierson St
- 11112 W Roxbury Place