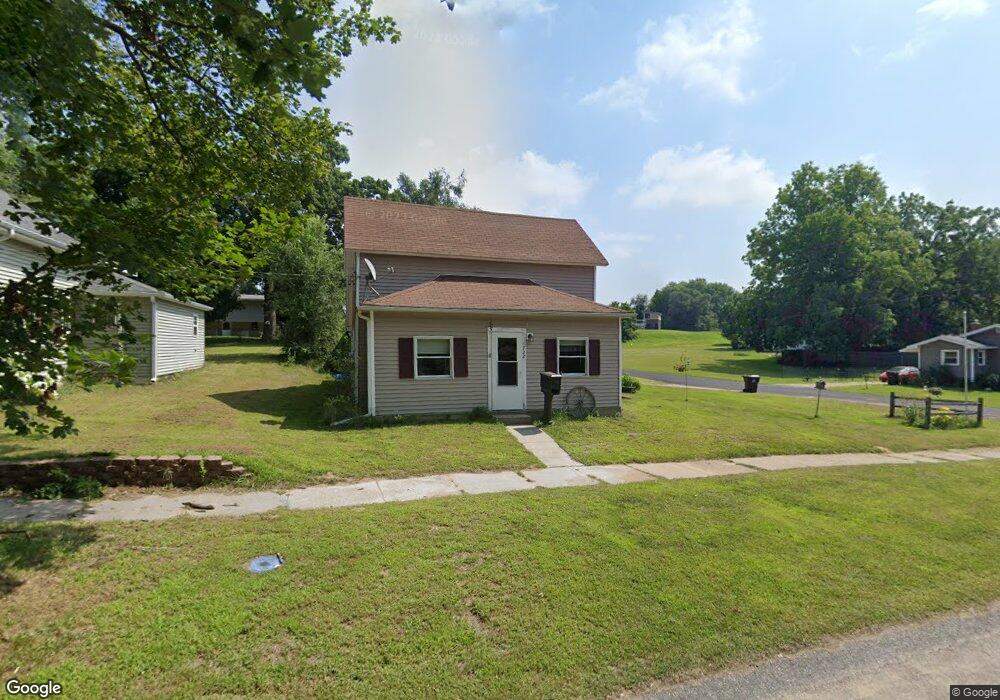
722 James St Belding, MI 48809
Estimated Value: $159,000 - $194,000
3
Beds
1
Bath
1,080
Sq Ft
$166/Sq Ft
Est. Value
About This Home
This home is located at 722 James St, Belding, MI 48809 and is currently estimated at $179,644, approximately $166 per square foot. 722 James St is a home located in Ionia County with nearby schools including Ellis Elementary School, Woodview Elementary School, and Belding Middle School.
Ownership History
Date
Name
Owned For
Owner Type
Purchase Details
Closed on
Oct 19, 2007
Sold by
Strause & Lynn Llc
Bought by
Cunningham Scott and Cunningham Tami
Current Estimated Value
Home Financials for this Owner
Home Financials are based on the most recent Mortgage that was taken out on this home.
Original Mortgage
$79,273
Outstanding Balance
$49,929
Interest Rate
6.38%
Mortgage Type
FHA
Estimated Equity
$129,715
Purchase Details
Closed on
Jan 27, 2006
Sold by
Harper Ronald H and Harper Darla N
Bought by
Strause & Lynn Llc
Home Financials for this Owner
Home Financials are based on the most recent Mortgage that was taken out on this home.
Original Mortgage
$58,000
Interest Rate
6.46%
Mortgage Type
Purchase Money Mortgage
Purchase Details
Closed on
Sep 19, 2003
Sold by
Hickey Nancy
Bought by
Harper Ronald H and Harper Darla N
Create a Home Valuation Report for This Property
The Home Valuation Report is an in-depth analysis detailing your home's value as well as a comparison with similar homes in the area
Home Values in the Area
Average Home Value in this Area
Purchase History
| Date | Buyer | Sale Price | Title Company |
|---|---|---|---|
| Cunningham Scott | $79,900 | Chicago Title | |
| Strause & Lynn Llc | $29,900 | Chicago Title Insurance Co | |
| Harper Ronald H | $26,000 | -- |
Source: Public Records
Mortgage History
| Date | Status | Borrower | Loan Amount |
|---|---|---|---|
| Open | Cunningham Scott | $79,273 | |
| Previous Owner | Strause & Lynn Llc | $58,000 |
Source: Public Records
Tax History
| Year | Tax Paid | Tax Assessment Tax Assessment Total Assessment is a certain percentage of the fair market value that is determined by local assessors to be the total taxable value of land and additions on the property. | Land | Improvement |
|---|---|---|---|---|
| 2025 | $1,337 | $67,200 | $12,300 | $54,900 |
| 2024 | $13 | $67,200 | $12,300 | $54,900 |
| 2023 | $1,202 | $50,000 | $11,300 | $38,700 |
| 2022 | $1,145 | $50,000 | $11,300 | $38,700 |
| 2021 | $1,188 | $41,200 | $7,300 | $33,900 |
| 2020 | $1,109 | $41,200 | $7,300 | $33,900 |
| 2019 | $1,039 | $38,000 | $7,000 | $31,000 |
| 2018 | $1,162 | $33,700 | $8,000 | $25,700 |
| 2017 | $1,048 | $33,700 | $8,000 | $25,700 |
| 2016 | $1,039 | $28,300 | $5,000 | $23,300 |
| 2015 | -- | $28,300 | $5,000 | $23,300 |
| 2014 | $1,161 | $26,700 | $4,800 | $21,900 |
Source: Public Records
Map
Nearby Homes
- 107 W Center St
- 322 Alderman St
- 721 Pearl St
- 616 S Broas St
- 918 S Broas St
- 516 S Front St
- 632 Edgewood St
- 753 W State St
- 421 Lewis St
- 6961 Riverwood Dr
- 740 Crawford St
- 208 Leonard St
- 216 Leonard St
- 206 Pine Meadow Dr
- 129 Midway St
- 2160 W Ellis Parcel 6
- 2160 W Ellis Parcel 5
- 7762 Sierra Dr
- 2160 W Ellis Parcel 2
- 2160 W Ellis Parcel 3
Your Personal Tour Guide
Ask me questions while you tour the home.