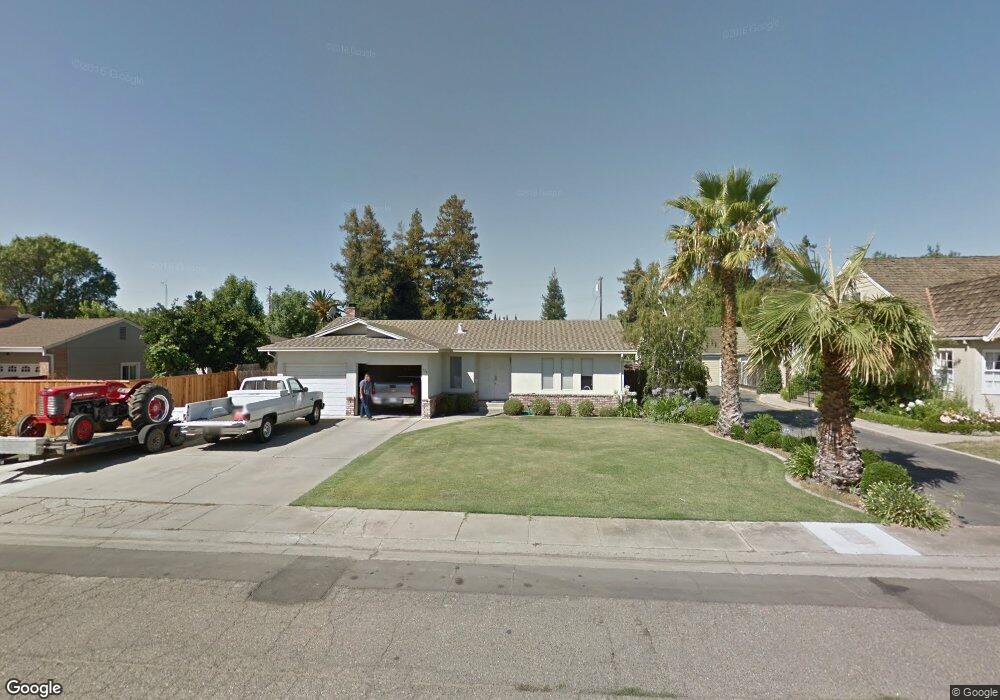
724 N 3rd St Patterson, CA 95363
Estimated Value: $473,701 - $512,000
3
Beds
2
Baths
1,719
Sq Ft
$285/Sq Ft
Est. Value
About This Home
This home is located at 724 N 3rd St, Patterson, CA 95363 and is currently estimated at $489,925, approximately $285 per square foot. 724 N 3rd St is a home located in Stanislaus County with nearby schools including Northmead Elementary School, Creekside Middle School, and Patterson High School.
Ownership History
Date
Name
Owned For
Owner Type
Purchase Details
Closed on
May 18, 2010
Sold by
Bernard Carolyn
Bought by
Bernard John
Current Estimated Value
Purchase Details
Closed on
Jul 6, 2007
Sold by
Bernard John
Bought by
Bernard John and Bernard Carolyn
Home Financials for this Owner
Home Financials are based on the most recent Mortgage that was taken out on this home.
Original Mortgage
$155,000
Outstanding Balance
$95,968
Interest Rate
6.41%
Mortgage Type
New Conventional
Estimated Equity
$393,957
Purchase Details
Closed on
Dec 7, 1993
Sold by
Bernard John
Bought by
Bernard John and Bernard Carolyn
Home Financials for this Owner
Home Financials are based on the most recent Mortgage that was taken out on this home.
Original Mortgage
$121,306
Interest Rate
6.89%
Create a Home Valuation Report for This Property
The Home Valuation Report is an in-depth analysis detailing your home's value as well as a comparison with similar homes in the area
Home Values in the Area
Average Home Value in this Area
Purchase History
| Date | Buyer | Sale Price | Title Company |
|---|---|---|---|
| Bernard John | -- | None Available | |
| Bernard John | -- | None Available | |
| Bernard John | -- | Alliance Title Company | |
| Bernard John | -- | Fidelity National Title |
Source: Public Records
Mortgage History
| Date | Status | Borrower | Loan Amount |
|---|---|---|---|
| Open | Bernard John | $155,000 | |
| Closed | Bernard John | $121,306 |
Source: Public Records
Tax History
| Year | Tax Paid | Tax Assessment Tax Assessment Total Assessment is a certain percentage of the fair market value that is determined by local assessors to be the total taxable value of land and additions on the property. | Land | Improvement |
|---|---|---|---|---|
| 2025 | $3,162 | $279,555 | $108,213 | $171,342 |
| 2024 | $3,151 | $274,075 | $106,092 | $167,983 |
| 2023 | $3,078 | $268,702 | $104,012 | $164,690 |
| 2022 | $2,900 | $263,434 | $101,973 | $161,461 |
| 2021 | $2,875 | $258,270 | $99,974 | $158,296 |
| 2020 | $2,858 | $255,622 | $98,949 | $156,673 |
| 2019 | $2,813 | $250,610 | $97,009 | $153,601 |
| 2018 | $2,674 | $245,697 | $95,107 | $150,590 |
| 2017 | $2,616 | $240,881 | $93,243 | $147,638 |
| 2016 | $2,543 | $236,159 | $91,415 | $144,744 |
| 2015 | $2,285 | $212,500 | $30,000 | $182,500 |
| 2014 | $1,888 | $177,000 | $25,000 | $152,000 |
Source: Public Records
Map
Nearby Homes
- 701 N 3rd St
- 140 Ivy Ave Unit A5
- 140 Ivy Ave Unit 39
- 647 Ward Ave
- 642 Wanzia Ct
- 216 Barros St
- 192 Torvend Way
- 14125 Ward Ave
- 409 Osprey Dr
- 608 Somerset Way
- 801 Chatham Ln
- 1430 Walnut Ave
- 813 Chatham Ln
- 817 Chatham Ln
- 821 Chatham Ln
- 829 Chatham Ln
- 833 Chatham Ln
- 800 Chatham Ln
- 804 Chatham Ln
- 812 Chatham Ln
Your Personal Tour Guide
Ask me questions while you tour the home.