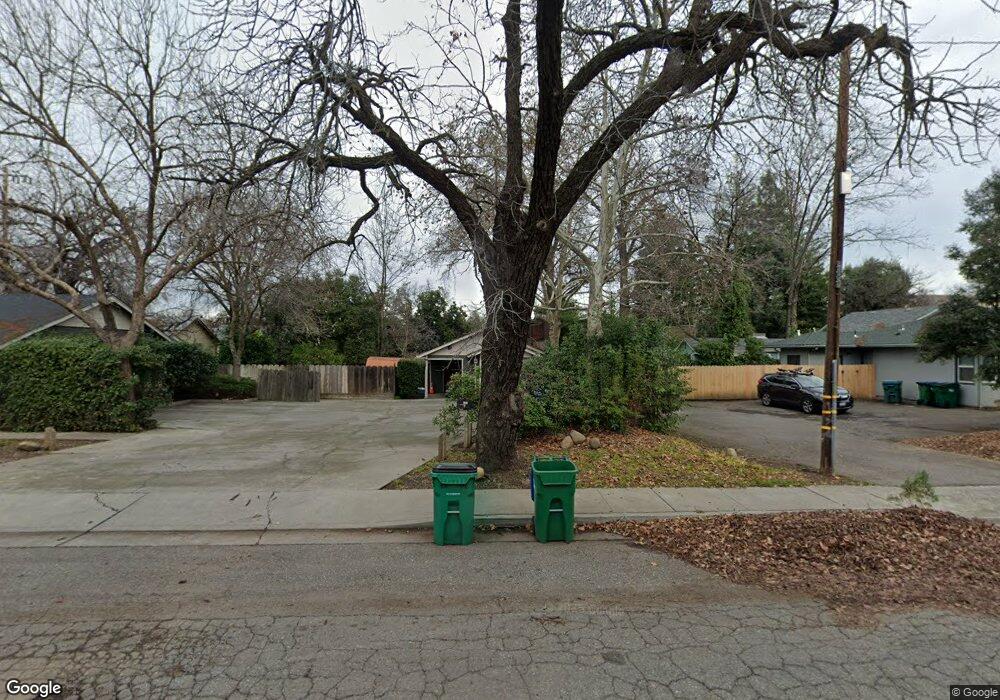
725 Oak St Chico, CA 95928
South Campus NeighborhoodEstimated Value: $347,000 - $382,000
4
Beds
2
Baths
--
Sq Ft
4,356
Sq Ft Lot
About This Home
This home is located at 725 Oak St, Chico, CA 95928 and is currently estimated at $368,828. 725 Oak St is a home located in Butte County with nearby schools including Emma Wilson Elementary School, Chico Junior High School, and Chico High School.
Ownership History
Date
Name
Owned For
Owner Type
Purchase Details
Closed on
Oct 11, 2006
Sold by
Jergentz Erin R and Jergentz Kimberley D
Bought by
Jergentz Erin R and Jergentz Kimberley D
Current Estimated Value
Purchase Details
Closed on
Jun 8, 2004
Sold by
Henderson Jerald H and Henderson Frances H
Bought by
Jergentz Erin R and Jergentz Kimberley D
Home Financials for this Owner
Home Financials are based on the most recent Mortgage that was taken out on this home.
Original Mortgage
$184,000
Interest Rate
5.99%
Mortgage Type
Stand Alone Second
Create a Home Valuation Report for This Property
The Home Valuation Report is an in-depth analysis detailing your home's value as well as a comparison with similar homes in the area
Home Values in the Area
Average Home Value in this Area
Purchase History
| Date | Buyer | Sale Price | Title Company |
|---|---|---|---|
| Jergentz Erin R | -- | None Available | |
| Jergentz Erin R | -- | None Available | |
| Jergentz Erin R | $460,000 | Mid Valley Title & Escrow Co |
Source: Public Records
Mortgage History
| Date | Status | Borrower | Loan Amount |
|---|---|---|---|
| Previous Owner | Jergentz Erin R | $184,000 |
Source: Public Records
Tax History
| Year | Tax Paid | Tax Assessment Tax Assessment Total Assessment is a certain percentage of the fair market value that is determined by local assessors to be the total taxable value of land and additions on the property. | Land | Improvement |
|---|---|---|---|---|
| 2025 | $3,618 | $331,257 | $113,733 | $217,524 |
| 2024 | $3,618 | $324,762 | $111,503 | $213,259 |
| 2023 | $3,576 | $318,395 | $109,317 | $209,078 |
| 2022 | $3,522 | $312,153 | $107,174 | $204,979 |
| 2021 | $3,452 | $306,033 | $105,073 | $200,960 |
| 2020 | $3,445 | $302,896 | $103,996 | $198,900 |
| 2019 | $3,385 | $296,957 | $101,957 | $195,000 |
| 2018 | $2,858 | $250,000 | $125,000 | $125,000 |
| 2017 | $2,852 | $250,000 | $125,000 | $125,000 |
| 2016 | $2,657 | $250,000 | $125,000 | $125,000 |
| 2015 | $2,376 | $220,000 | $95,000 | $125,000 |
| 2014 | $2,158 | $200,000 | $80,000 | $120,000 |
Source: Public Records
Map
Nearby Homes
Your Personal Tour Guide
Ask me questions while you tour the home.