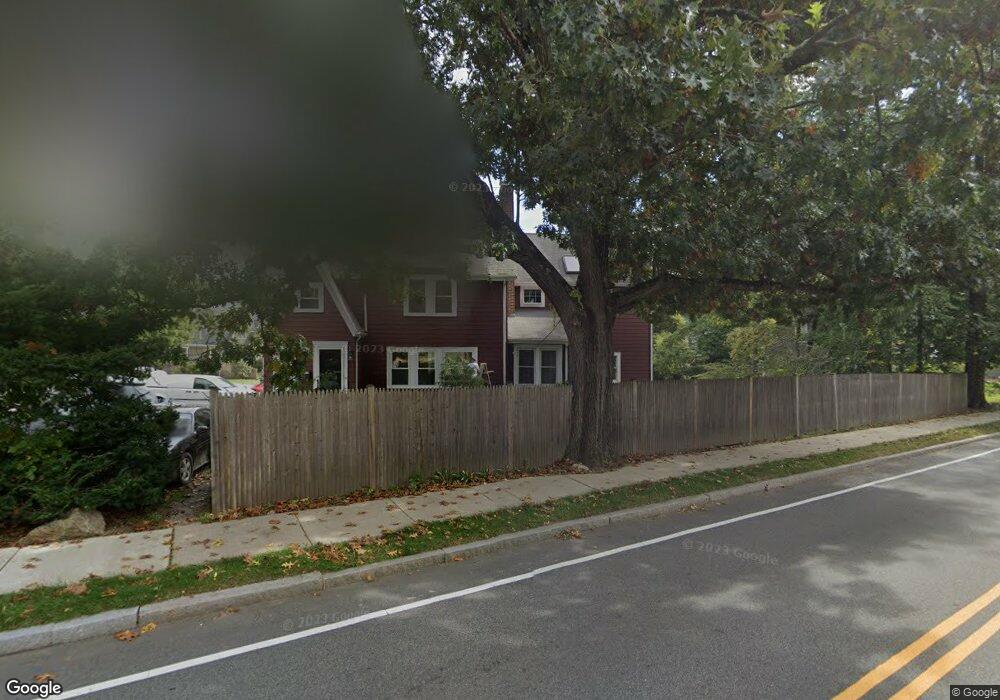
726 Chestnut St Waban, MA 02468
Waban NeighborhoodEstimated Value: $1,600,456 - $1,739,000
4
Beds
3
Baths
2,306
Sq Ft
$719/Sq Ft
Est. Value
About This Home
This home is located at 726 Chestnut St, Waban, MA 02468 and is currently estimated at $1,658,614, approximately $719 per square foot. 726 Chestnut St is a home located in Middlesex County with nearby schools including Angier Elementary School, Charles E Brown Middle School, and Newton South High School.
Ownership History
Date
Name
Owned For
Owner Type
Purchase Details
Closed on
Nov 6, 1991
Sold by
Sullivan Lawrence J and Sullivan Christine
Bought by
Cohen Jeffrey A and Cohen Wendy S
Current Estimated Value
Home Financials for this Owner
Home Financials are based on the most recent Mortgage that was taken out on this home.
Original Mortgage
$105,000
Interest Rate
8.85%
Mortgage Type
Purchase Money Mortgage
Create a Home Valuation Report for This Property
The Home Valuation Report is an in-depth analysis detailing your home's value as well as a comparison with similar homes in the area
Home Values in the Area
Average Home Value in this Area
Purchase History
| Date | Buyer | Sale Price | Title Company |
|---|---|---|---|
| Cohen Jeffrey A | $176,000 | -- |
Source: Public Records
Mortgage History
| Date | Status | Borrower | Loan Amount |
|---|---|---|---|
| Open | Cohen Jeffrey A | $170,000 | |
| Closed | Cohen Jeffrey A | $104,000 | |
| Closed | Cohen Jeffrey A | $104,000 | |
| Closed | Cohen Jeffrey A | $105,000 |
Source: Public Records
Tax History
| Year | Tax Paid | Tax Assessment Tax Assessment Total Assessment is a certain percentage of the fair market value that is determined by local assessors to be the total taxable value of land and additions on the property. | Land | Improvement |
|---|---|---|---|---|
| 2025 | $10,935 | $1,115,800 | $1,009,900 | $105,900 |
| 2024 | $10,573 | $1,083,300 | $980,500 | $102,800 |
| 2023 | $10,125 | $994,600 | $746,600 | $248,000 |
| 2022 | $9,688 | $920,900 | $691,300 | $229,600 |
| 2021 | $6,154 | $868,800 | $652,200 | $216,600 |
| 2020 | $9,070 | $868,800 | $652,200 | $216,600 |
| 2019 | $6,334 | $843,500 | $633,200 | $210,300 |
| 2018 | $5,610 | $782,000 | $573,700 | $208,300 |
| 2017 | $5,348 | $737,700 | $541,200 | $196,500 |
| 2016 | $7,845 | $689,400 | $505,800 | $183,600 |
| 2015 | $7,480 | $644,300 | $472,700 | $171,600 |
Source: Public Records
Map
Nearby Homes
- 34 Larchmont Ave
- 110 Avalon Rd
- 20 Kinmonth Rd Unit 203
- 20 Kinmonth Rd Unit 306
- 20 Kinmonth Rd Unit 4
- 29 Montclair Rd
- 873 Chestnut St
- 126 Beethoven Ave
- 115 Windsor Rd
- 18 Moffat Rd
- 15 Gammons Rd
- 138 Waban Ave
- 19 Gordon Rd
- 55 Evelyn Rd
- 155 Paulson Rd
- 1077 Boylston St Unit 1
- 59 Roundwood Rd
- 1003 Chestnut St
- 0 Metacomet Rd
- 33 Metacomet Rd
- 15 Larchmont Ave
- 736 Chestnut St
- 725 Chestnut St
- 21 Larchmont Ave
- 712 Chestnut St
- 733 Chestnut St
- 14 Larchmont Ave
- 103 Larchmont Ave
- 25 Larchmont Ave
- 12 Wyman St
- 737 Chestnut St
- 711 Chestnut St
- 711 Chestnut St Unit 3
- 20 Larchmont Ave
- 743 Chestnut St
- 95 Larchmont Ave
- 26 Larchmont Ave
- 13 Wyman Farm Unit 26
- 702 Chestnut St
- 33 Larchmont Ave
Your Personal Tour Guide
Ask me questions while you tour the home.