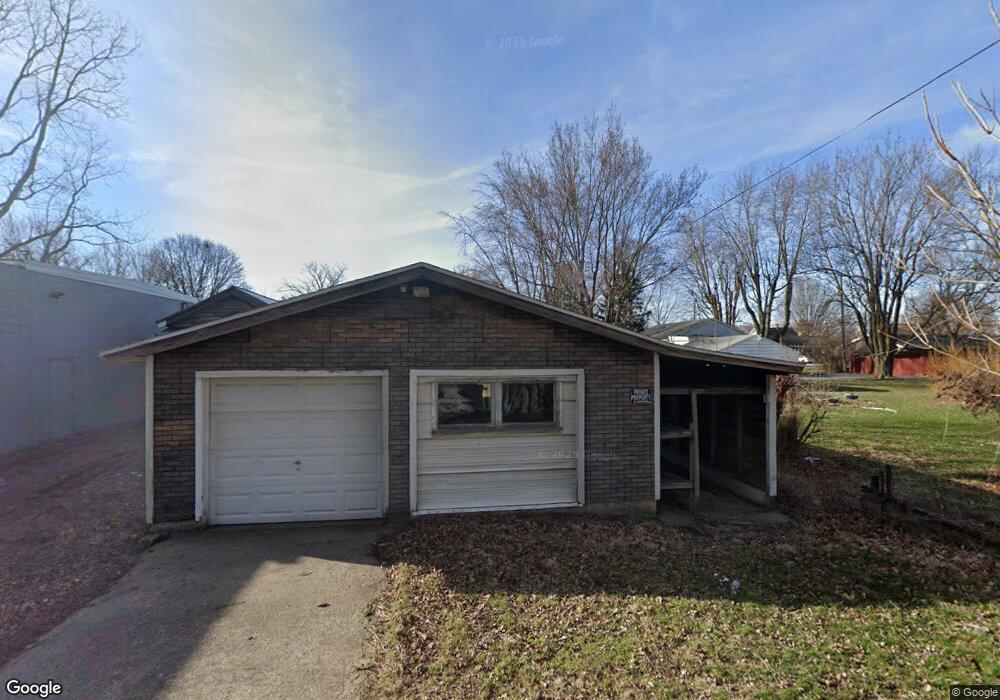
726 Frazer St Findlay, OH 45840
Estimated Value: $91,000 - $157,000
3
Beds
1
Bath
1,419
Sq Ft
$85/Sq Ft
Est. Value
About This Home
This home is located at 726 Frazer St, Findlay, OH 45840 and is currently estimated at $120,488, approximately $84 per square foot. 726 Frazer St is a home located in Hancock County with nearby schools including Whittier Primary School, Bigelow Hill Elementary School, and Glenwood Middle School.
Ownership History
Date
Name
Owned For
Owner Type
Purchase Details
Closed on
Jul 15, 2025
Sold by
Brown Jordon L and Aversch Holly C
Bought by
Ross Thomas A and Ross Maria R
Current Estimated Value
Purchase Details
Closed on
Nov 18, 2021
Sold by
Hca Properties Llc
Bought by
Averesch Holly C and Brown Jordon L
Home Financials for this Owner
Home Financials are based on the most recent Mortgage that was taken out on this home.
Original Mortgage
$61,750
Interest Rate
2.99%
Mortgage Type
New Conventional
Purchase Details
Closed on
Jan 16, 2012
Sold by
Kinn Kathryn
Bought by
Averesch Douglas A
Home Financials for this Owner
Home Financials are based on the most recent Mortgage that was taken out on this home.
Original Mortgage
$31,875
Interest Rate
3.25%
Mortgage Type
Future Advance Clause Open End Mortgage
Create a Home Valuation Report for This Property
The Home Valuation Report is an in-depth analysis detailing your home's value as well as a comparison with similar homes in the area
Home Values in the Area
Average Home Value in this Area
Purchase History
| Date | Buyer | Sale Price | Title Company |
|---|---|---|---|
| Ross Thomas A | $90,000 | Assured Title | |
| Ross Thomas A | $90,000 | Assured Title | |
| Averesch Holly C | $65,000 | Sbs Title Agency Llc | |
| Averesch Douglas A | $37,500 | Attorney |
Source: Public Records
Mortgage History
| Date | Status | Borrower | Loan Amount |
|---|---|---|---|
| Previous Owner | Averesch Holly C | $61,750 | |
| Previous Owner | Averesch Douglas A | $31,875 |
Source: Public Records
Tax History Compared to Growth
Tax History
| Year | Tax Paid | Tax Assessment Tax Assessment Total Assessment is a certain percentage of the fair market value that is determined by local assessors to be the total taxable value of land and additions on the property. | Land | Improvement |
|---|---|---|---|---|
| 2024 | $968 | $27,250 | $5,600 | $21,650 |
| 2023 | $970 | $27,250 | $5,600 | $21,650 |
| 2022 | $966 | $27,250 | $5,600 | $21,650 |
| 2021 | $708 | $17,390 | $5,600 | $11,790 |
| 2020 | $726 | $17,390 | $5,600 | $11,790 |
| 2019 | $712 | $17,390 | $5,600 | $11,790 |
| 2018 | $602 | $13,490 | $4,740 | $8,750 |
| 2017 | $601 | $13,490 | $4,740 | $8,750 |
| 2016 | $997 | $13,490 | $4,740 | $8,750 |
| 2015 | $708 | $15,750 | $4,740 | $11,010 |
| 2014 | $708 | $15,750 | $4,740 | $11,010 |
| 2012 | $659 | $14,510 | $4,740 | $9,770 |
Source: Public Records
Map
Nearby Homes
- 1005 Broad Ave
- 533 Davis St
- 604 Davis St
- 524 Defiance Ave
- 224 Defiance Ave
- 706 N Cory St
- 410 Monroe Ave
- 405 Clifton Ave
- 512 N Cory St
- 115 George St
- 304 Rector Ave
- 210 Western Ave
- 643 Edith Ave
- 207 Ash Ave
- 206 Midland Ave
- 304 Prentiss Ave
- 0 County Road 223
- 905 W Melrose Ave
- 407 Washington St
- 915 W Main Cross St