72605 220th Ave Hayfield, MN 55940
Estimated payment $22,568/month
About This Home
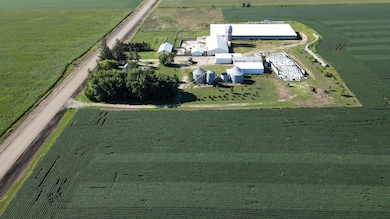
Feedlot Description:
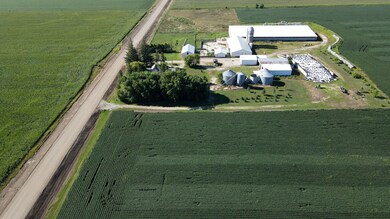
Don't miss your chance to own this 999 cattle permitted, turn-key feed lot located just outside of Hayfield, MN in the heart of Dodge County which boasts some of the most productive land in the state. This property has an abundance of sheds, silos, grain bins, fencing and a massive bunker to support this productive operation.
In addition to the feed lot, the package includes a total 260.1+/- of some of the most productive land in the county which has pattern tiling and boasts an excellent 95.3 average CP| rating as depicted below.
Feedlot Features:
-2012 - 280' * 100' Mono sloped cattle shed
-2013 - 100' *58' cattle shed
-1990 - 40' * 36' heated shop with 24' * 30' overhead doors
-2007 -64' *40' shop with concrete floors
-150' *60' concrete bunker with 8' high walls (full of feed)
-Numerous other sheds, bins and silos to support the operation
-1176sf 2 bedroom, 1bath home with an oversized 2 car attached garage
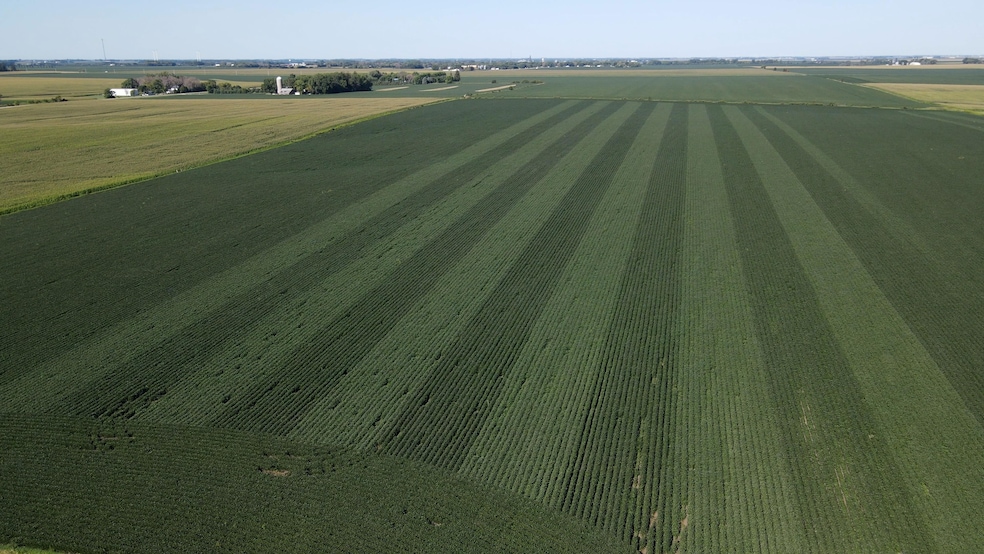
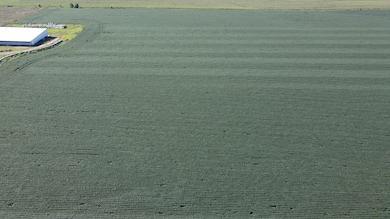
Row Crop Description:
These parcels represent a combined 260.1+- acres and are being sold as a package with the feedlot. All tracts are pattern tiled, highly productive and have great access. This is very sought-after land in Southern Minnesota that does not come on the market often so dont miss your chance to own these A+ farms for your portfolio. This package deal would make for great 1031 exchanges or for anyone looking for the stability of land as an investment or to expand operations of an existing operator.
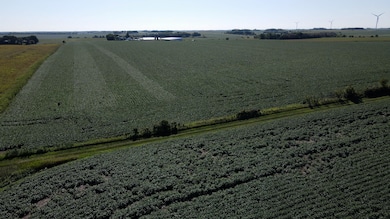
Middle Tract Description: This parcel, a short .3 mile north, is 80+- acres and is comprised of 74.2+- tillable acres with an impressive 95.7 CPI. This parcel is also pattern tiled and has excellent access with unbelievable quality and proximity to the feedlot.
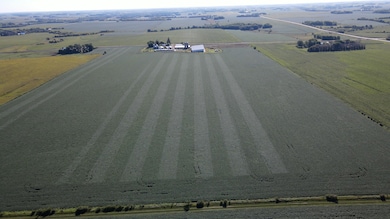
South Tract Description:This parcel (feedlot location) is 79.5+- acres and is comprised of 71.3+- tillable acres with an impressive 97.2 CPI. This parcel, like the others, is pattern tiled and has excellent access with unbelievable quality and proximity to the feedlot.
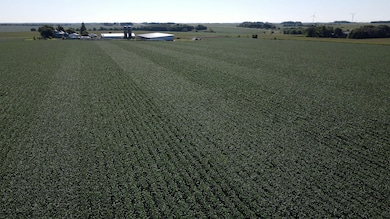
East Tract Description:This parcel, immediately east of the feedlot, is 100.6+- acres and is comprised of 91.9+- tillable acres with an impressive 94.2 CPI. This parcel is pattern tiled and has excellent access with unbelievable quality and proximity to the feedlot.
Row Crop Features:
-Very Strong CPI of 95.3
-Easy access
-Well Pattern Tiled
-Access off a newly paved road
Address: 72605 220th Ave, Hayfield, MN, 55940-8782
Land in Dodge County is highly sought after and seldom comes available yet with such quality and placement.

Home Details
Home Type
- Single Family
Est. Annual Taxes
- $5,262
Lot Details
- Current uses include agriculture, feed lot, agribusiness
- Potential uses include agriculture, feed lot
Bedrooms and Bathrooms
- 2 Bedrooms
- 1 Full Bathroom
Map
Home Values in the Area
Average Home Value in this Area
Tax History
| Year | Tax Paid | Tax Assessment Tax Assessment Total Assessment is a certain percentage of the fair market value that is determined by local assessors to be the total taxable value of land and additions on the property. | Land | Improvement |
|---|---|---|---|---|
| 2025 | $5,262 | $1,826,400 | $950,300 | $876,100 |
| 2024 | $6,736 | $1,793,600 | $926,200 | $867,400 |
| 2023 | $5,604 | $1,561,200 | $891,200 | $670,000 |
| 2022 | $5,734 | $1,331,200 | $652,700 | $678,500 |
| 2021 | $5,584 | $748,400 | $627,000 | $121,400 |
| 2020 | $5,702 | $739,500 | $622,000 | $117,500 |
| 2019 | $4,624 | $731,800 | $622,000 | $109,800 |
| 2018 | $4,778 | $1,039,800 | $586,700 | $453,100 |
| 2017 | $4,312 | $1,030,500 | $586,700 | $443,800 |
| 2016 | $4,064 | $1,026,900 | $618,300 | $408,600 |
| 2015 | $3,586 | $1,057,900 | $663,500 | $394,400 |
| 2014 | $2,506 | $0 | $0 | $0 |
Property History
| Date | Event | Price | Change | Sq Ft Price |
|---|---|---|---|---|
| 07/24/2025 07/24/25 | For Sale | $3,999,000 | 0.0% | $3,401 / Sq Ft |
| 05/02/2025 05/02/25 | Off Market | $3,999,000 | -- | -- |
| 04/01/2025 04/01/25 | For Sale | $3,999,000 | 0.0% | $3,401 / Sq Ft |
| 12/28/2024 12/28/24 | Off Market | $3,999,000 | -- | -- |
| 08/01/2024 08/01/24 | For Sale | $3,999,000 | -- | $3,401 / Sq Ft |
Purchase History
| Date | Type | Sale Price | Title Company |
|---|---|---|---|
| Interfamily Deed Transfer | -- | None Available |
Mortgage History
| Date | Status | Loan Amount | Loan Type |
|---|---|---|---|
| Closed | $300,000 | Credit Line Revolving |
- 104 1st St NW
- 1005 11th Ave NW
- 308 9th Ave NE
- 739 Valley View Ct NE
- 1075 4th St NE
- 1151 4th St NE
- 692 Stone Haven Dr
- 634 Shardlow Ln NE
- 1501 11th Ave NW
- 2244 Petersen Dr NW
- 105 S Main St
- 103 Lookout Ln NW
- 4888 Tee Ct SW
- 4121 5th Place NW
- 2301 Crystal Bay Ct SW
- 3733 3rd Place NW
- 574 Pointe Ct SW
- 506 Pointe Ct SW
- 3250 Avalon Cove Ln NW
- 957 NW Pendant Ln