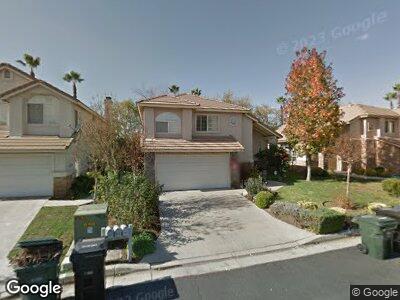
7268 Rancho Rosa Way Unit 9 Rancho Cucamonga, CA 91701
Red Hill NeighborhoodEstimated Value: $760,998 - $803,000
3
Beds
3
Baths
1,836
Sq Ft
$428/Sq Ft
Est. Value
About This Home
This home is located at 7268 Rancho Rosa Way Unit 9, Rancho Cucamonga, CA 91701 and is currently estimated at $785,750, approximately $427 per square foot. 7268 Rancho Rosa Way Unit 9 is a home located in San Bernardino County with nearby schools including Foothill Knolls STEM Academy of Innovation, Upland High School, and St. Joseph Elementary School.
Ownership History
Date
Name
Owned For
Owner Type
Purchase Details
Closed on
Oct 29, 2014
Sold by
Roth Richard L
Bought by
Roth Family Trust
Current Estimated Value
Purchase Details
Closed on
Sep 4, 2002
Sold by
Roth Richard L
Bought by
Roth Richard L and Roth Adella Anne
Home Financials for this Owner
Home Financials are based on the most recent Mortgage that was taken out on this home.
Original Mortgage
$190,760
Interest Rate
6.29%
Mortgage Type
Unknown
Purchase Details
Closed on
Sep 23, 1998
Sold by
Roth Richard L
Bought by
Roth Richard L and Snyder Roth Anne
Purchase Details
Closed on
Mar 20, 1997
Sold by
Rittenhouse Ralph G
Bought by
Roth Richard L and Snyder Roth Anne
Home Financials for this Owner
Home Financials are based on the most recent Mortgage that was taken out on this home.
Original Mortgage
$186,450
Interest Rate
7.86%
Create a Home Valuation Report for This Property
The Home Valuation Report is an in-depth analysis detailing your home's value as well as a comparison with similar homes in the area
Home Values in the Area
Average Home Value in this Area
Purchase History
| Date | Buyer | Sale Price | Title Company |
|---|---|---|---|
| Roth Family Trust | -- | None Available | |
| Roth Richard L | -- | Chicago Title Co | |
| Roth Richard L | -- | Commonwealth Land Title Co | |
| Roth Richard L | $196,500 | Commonwealth Land Title Co |
Source: Public Records
Mortgage History
| Date | Status | Borrower | Loan Amount |
|---|---|---|---|
| Closed | Roth Adella Anne | $169,425 | |
| Closed | Roth Richard L | $194,000 | |
| Closed | Roth Adella Anne | $190,760 | |
| Closed | Roth Richard L | $187,000 | |
| Closed | Roth Richard L | $186,450 |
Source: Public Records
Tax History Compared to Growth
Tax History
| Year | Tax Paid | Tax Assessment Tax Assessment Total Assessment is a certain percentage of the fair market value that is determined by local assessors to be the total taxable value of land and additions on the property. | Land | Improvement |
|---|---|---|---|---|
| 2024 | $3,478 | $323,948 | $68,449 | $255,499 |
| 2023 | $3,427 | $317,596 | $67,107 | $250,489 |
| 2022 | $3,355 | $311,368 | $65,791 | $245,577 |
| 2021 | $3,353 | $305,263 | $64,501 | $240,762 |
| 2020 | $3,264 | $302,133 | $63,840 | $238,293 |
| 2019 | $3,251 | $296,209 | $62,588 | $233,621 |
| 2018 | $3,171 | $290,401 | $61,361 | $229,040 |
| 2017 | $3,081 | $284,707 | $60,158 | $224,549 |
| 2016 | $3,044 | $279,124 | $58,978 | $220,146 |
| 2015 | $2,976 | $274,931 | $58,092 | $216,839 |
| 2014 | $2,900 | $269,545 | $56,954 | $212,591 |
Source: Public Records
Map
Nearby Homes
- 1526 Cole Ln
- 8535 La Vine St
- 8641 La Grande St
- 7586 Cerrito Rojo Dr
- 8672 La Grande St
- 7563 Alta Cuesta Dr
- 1314 N North Hills Dr
- 1347 Cole Ln
- 6880 Topaz St
- 1268 Upland Hills Dr S
- 1303 Swan Loop S
- 1244 Winged Foot Dr Unit 24
- 8784 Lurline St
- 1661 Danbrook Place
- 1635 Hogan Ct
- 1461 E 14th St
- 1635 Faldo Ct
- 1190 Winged Foot Dr
- 7822 Alta Cuesta Dr
- 8371 Hawthorne St
- 7268 Rancho Rosa Way Unit 9
- 7276 Rancho Rosa Way
- 7260 Rancho Rosa Way Unit 1
- 7260 Rancho Rosa Way
- 8349 Derfer Dr Unit 7
- 8357 Derfer Dr
- 8366 Derfer Dr
- 7244 Rancho Rosa Way Unit 12
- 8365 Derfer Dr
- 8374 Derfer Dr
- 7253 Rancho Rosa Way
- 8373 Derfer Dr
- 7243 Rancho Rosa Way
- 7236 Rancho Rosa Way
- 7228 Rancho Rosa Way Unit 14
- 7220 Rancho Rosa Way Unit 15A
- 8383 Derfer Dr
- 7212 Rancho Rosa Way
- 8352 Via Ladera
- 7247 Linden Ln