
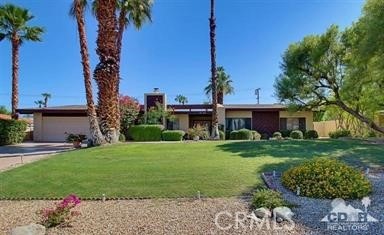
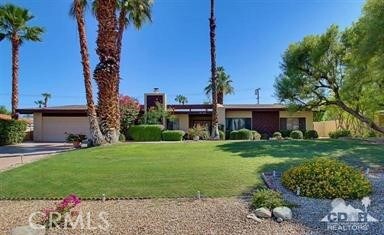
72977 Bursera Way Palm Desert, CA 92260
Estimated Value: $813,000 - $1,114,000
3
Beds
2.5
Baths
2,260
Sq Ft
$456/Sq Ft
Est. Value
Highlights
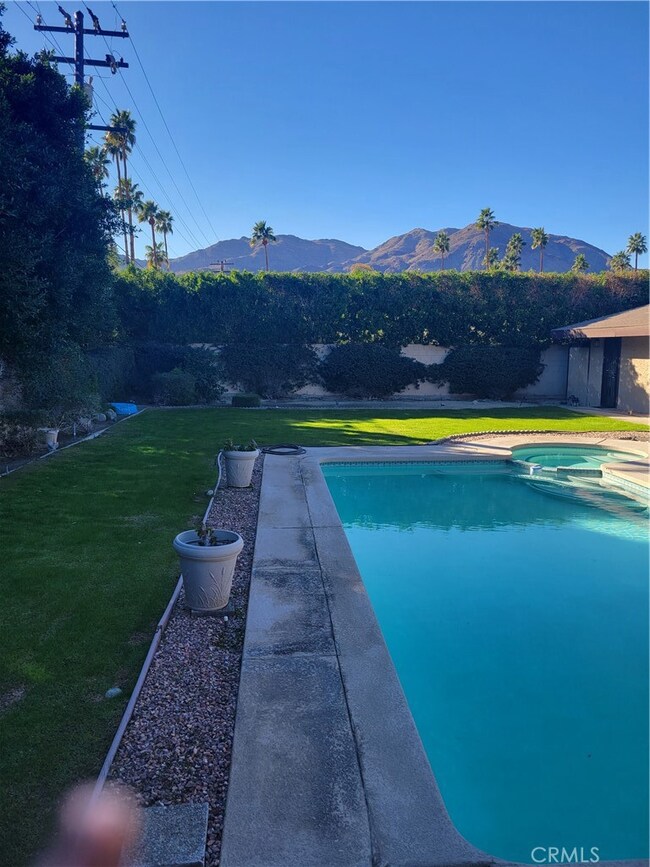
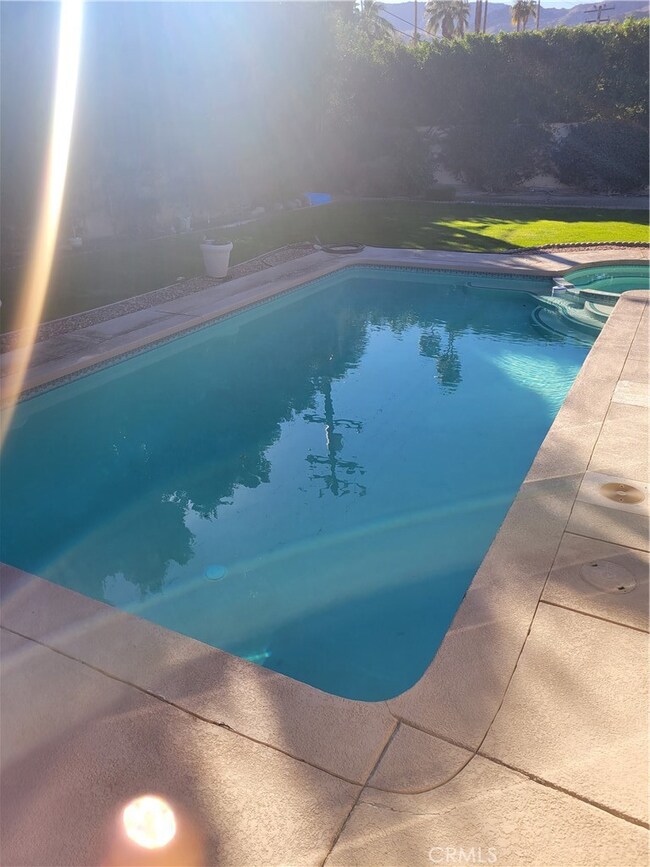
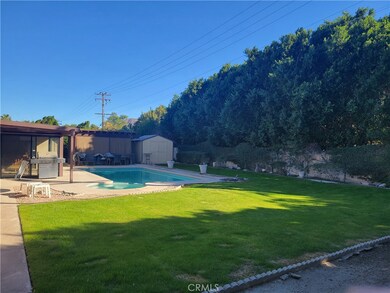
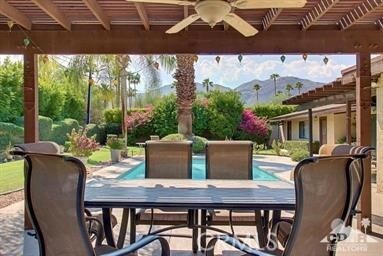
- Private Pool
- Solar Power System
- Retreat
- Palm Desert High School Rated A
- Open Floorplan
- Park or Greenbelt View
About This Home
As of March 2022Location, Location, Location South Palm Desert Traditional sale! Stunning Palm Desert home sits on over 13,000 SFT and enjoys major improvements & renovations! Newer paint, carpet, fixtures, granite and stainless-steel appliances are just a few of the improvements made to the home. The home offers endless space for families or entertaining, the master is oversized with shutters & large spa-like bathroom, with an entry out to pool. Breathtaking views outside of the front and back windows! A Beautiful pool & spa awaits you in the backyard, tons of storage/ parking & a huge lot!
Convenient to El Paseo, Westfield Mall, McCallum Theater and much more. Come take a look!!!
Home Details
Home Type
- Single Family
Est. Annual Taxes
- $13,761
Year Built
- Built in 1977
Lot Details
- 0.3 Acre Lot
- Sprinkler System
- Private Yard
- Lawn
- Property is zoned R112M
Parking
- 2 Car Direct Access Garage
- Parking Available
- Driveway
Property Views
- Park or Greenbelt
- Neighborhood
- Courtyard
Interior Spaces
- 2,260 Sq Ft Home
- 1-Story Property
- Open Floorplan
- Built-In Features
- Ceiling Fan
- Shutters
- Entryway
- Family Room Off Kitchen
- Living Room with Fireplace
- Laundry Room
Kitchen
- Eat-In Kitchen
- Breakfast Bar
- Built-In Range
- Dishwasher
- Granite Countertops
Flooring
- Carpet
- Tile
Bedrooms and Bathrooms
- 3 Main Level Bedrooms
- Retreat
- Dressing Area
Pool
- Private Pool
- Spa
Outdoor Features
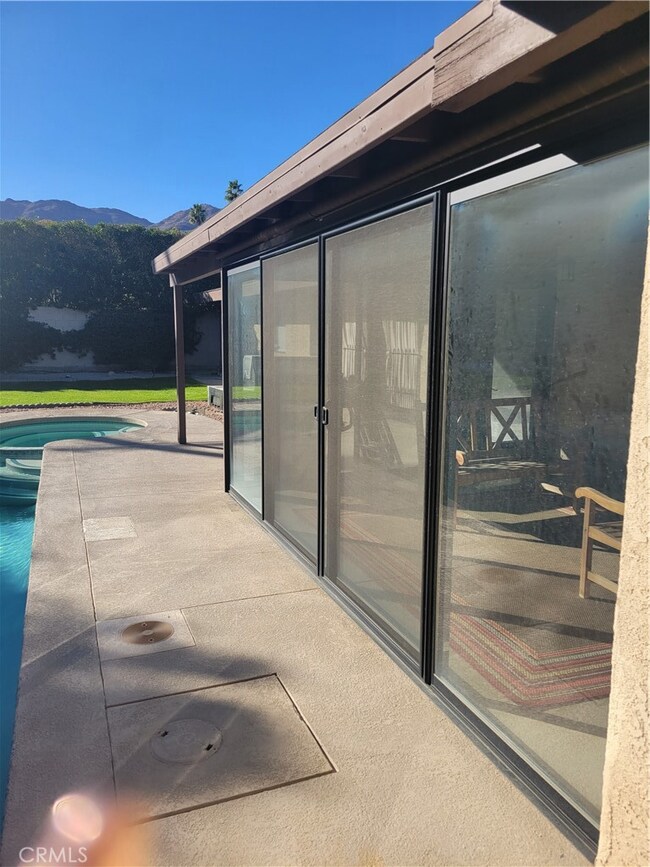
- Enclosed Glass Porch
- Patio
Additional Features
- Solar Power System
- Suburban Location
- Central Heating and Cooling System
Community Details
- No Home Owners Association
Listing and Financial Details
- Tax Lot 31
- Assessor Parcel Number 630073001
- $556 per year additional tax assessments
Ownership History
Date
Name
Owned For
Owner Type
Purchase Details
Listed on
Feb 18, 2022
Closed on
Mar 2, 2022
Sold by
Markarian Shavarsh H and Ma Jacqueline
Bought by
Madapi Francois Evon and Madath Donna Majekka
Seller's Agent
Jenifer Rallo
Dream Realty
Buyer's Agent
Jenifer Rallo
Dream Realty
List Price
$1,050,000
Sold Price
$1,000,000
Premium/Discount to List
-$50,000
-4.76%
Total Days on Market
8
Current Estimated Value
Home Financials for this Owner
Home Financials are based on the most recent Mortgage that was taken out on this home.
Estimated Appreciation
$30,969
Avg. Annual Appreciation
1.66%
Purchase Details
Closed on
Aug 26, 2019
Sold by
Markarian Jacqueline B
Bought by
Markarian Jacqueline B
Purchase Details
Listed on
Jan 23, 2017
Closed on
Apr 26, 2017
Sold by
Radu Diane
Bought by
Markarian Jacqueline B
Seller's Agent
Diane Radu
Windermere Homes & Estates
Buyer's Agent
Jon McGihon
Bennion Deville Homes
List Price
$519,500
Sold Price
$495,000
Premium/Discount to List
-$24,500
-4.72%
Home Financials for this Owner
Home Financials are based on the most recent Mortgage that was taken out on this home.
Avg. Annual Appreciation
9.85%
Purchase Details
Listed on
Aug 26, 2015
Closed on
Mar 29, 2016
Sold by
Loringer Susan E
Bought by
Radu Diane
Seller's Agent
June Johnson
Keller Williams Realty
Buyer's Agent
June Johnson
Keller Williams Realty
List Price
$529,000
Sold Price
$450,000
Premium/Discount to List
-$79,000
-14.93%
Home Financials for this Owner
Home Financials are based on the most recent Mortgage that was taken out on this home.
Avg. Annual Appreciation
10.21%
Original Mortgage
$675,000
Interest Rate
3.72%
Mortgage Type
Reverse Mortgage Home Equity Conversion Mortgage
Purchase Details
Closed on
Mar 28, 2003
Sold by
Loringer John E and Loringer Susan E
Bought by
Loringer John E and Loringer Susan E
Home Financials for this Owner
Home Financials are based on the most recent Mortgage that was taken out on this home.
Original Mortgage
$282,500
Interest Rate
3.87%
Mortgage Type
Purchase Money Mortgage
Purchase Details
Closed on
Aug 8, 2002
Sold by
Loringer John E and Loringer Susan E
Bought by
Loringer John E and Loringer Susan E
Home Financials for this Owner
Home Financials are based on the most recent Mortgage that was taken out on this home.
Original Mortgage
$280,000
Interest Rate
5.12%
Mortgage Type
Purchase Money Mortgage
Purchase Details
Closed on
May 15, 2002
Sold by
Loringer John E and Loringer Susan E
Bought by
Loringer John E and Loringer Susan E
Home Financials for this Owner
Home Financials are based on the most recent Mortgage that was taken out on this home.
Original Mortgage
$262,500
Interest Rate
5.62%
Mortgage Type
Unknown
Create a Home Valuation Report for This Property
The Home Valuation Report is an in-depth analysis detailing your home's value as well as a comparison with similar homes in the area
Similar Homes in the area
Home Values in the Area
Average Home Value in this Area
Purchase History
| Date | Buyer | Sale Price | Title Company |
|---|---|---|---|
| Madapi Francois Evon | $1,000,000 | Lawyers Title | |
| Markarian Jacqueline B | -- | None Available | |
| Markarian Jacqueline B | $495,000 | First American Title Company | |
| Radu Diane | $450,000 | Orange Coast Title Co | |
| Loringer John E | -- | Lawyers Title Company | |
| Loringer John E | -- | Lawyers Title Company | |
| Loringer John E | -- | Fidelity National Title Co | |
| Loringer John E | -- | Fidelity National Title Co | |
| Loringer John E | -- | Fidelity National Title Co |
Source: Public Records
Mortgage History
| Date | Status | Borrower | Loan Amount |
|---|---|---|---|
| Previous Owner | Radu Diane | $675,000 | |
| Previous Owner | Loringer John E | $250,000 | |
| Previous Owner | Loringer John E | $300,000 | |
| Previous Owner | Loringer John E | $282,500 | |
| Previous Owner | Loringer John E | $280,000 | |
| Previous Owner | Loringer John E | $262,500 | |
| Previous Owner | Loringer John E | $225,000 |
Source: Public Records
Property History
| Date | Event | Price | Change | Sq Ft Price |
|---|---|---|---|---|
| 03/11/2022 03/11/22 | Sold | $1,000,000 | -4.8% | $442 / Sq Ft |
| 02/18/2022 02/18/22 | For Sale | $1,050,000 | +112.1% | $465 / Sq Ft |
| 05/10/2017 05/10/17 | Sold | $495,000 | +1.0% | $219 / Sq Ft |
| 04/25/2017 04/25/17 | Pending | -- | -- | -- |
| 04/02/2017 04/02/17 | Price Changed | $489,900 | -3.1% | $217 / Sq Ft |
| 03/24/2017 03/24/17 | Price Changed | $505,500 | -2.7% | $224 / Sq Ft |
| 03/21/2017 03/21/17 | For Sale | $519,500 | 0.0% | $230 / Sq Ft |
| 03/21/2017 03/21/17 | Price Changed | $519,500 | -1.0% | $230 / Sq Ft |
| 03/07/2017 03/07/17 | Pending | -- | -- | -- |
| 03/03/2017 03/03/17 | For Sale | $524,500 | +6.0% | $232 / Sq Ft |
| 02/27/2017 02/27/17 | Off Market | $495,000 | -- | -- |
| 02/17/2017 02/17/17 | Price Changed | $524,500 | -2.4% | $232 / Sq Ft |
| 02/10/2017 02/10/17 | Price Changed | $537,500 | -2.3% | $238 / Sq Ft |
| 02/03/2017 02/03/17 | Price Changed | $549,900 | -1.8% | $243 / Sq Ft |
| 01/23/2017 01/23/17 | For Sale | $559,900 | +24.4% | $248 / Sq Ft |
| 05/19/2016 05/19/16 | Sold | $450,000 | -7.2% | $216 / Sq Ft |
| 03/26/2016 03/26/16 | Pending | -- | -- | -- |
| 03/08/2016 03/08/16 | Price Changed | $485,000 | -2.8% | $232 / Sq Ft |
| 02/10/2016 02/10/16 | Price Changed | $499,000 | -2.0% | $239 / Sq Ft |
| 01/03/2016 01/03/16 | Price Changed | $509,000 | -1.9% | $244 / Sq Ft |
| 10/08/2015 10/08/15 | Price Changed | $519,000 | -1.9% | $249 / Sq Ft |
| 09/29/2015 09/29/15 | For Sale | $529,000 | 0.0% | $253 / Sq Ft |
| 09/14/2015 09/14/15 | Pending | -- | -- | -- |
| 08/26/2015 08/26/15 | For Sale | $529,000 | -- | $253 / Sq Ft |
Source: California Regional Multiple Listing Service (CRMLS)
Tax History Compared to Growth
Tax History
| Year | Tax Paid | Tax Assessment Tax Assessment Total Assessment is a certain percentage of the fair market value that is determined by local assessors to be the total taxable value of land and additions on the property. | Land | Improvement |
|---|---|---|---|---|
| 2023 | $13,761 | $1,020,000 | $346,800 | $673,200 |
| 2022 | $7,213 | $541,350 | $162,404 | $378,946 |
| 2021 | $7,055 | $530,736 | $159,220 | $371,516 |
| 2020 | $6,930 | $525,295 | $157,588 | $367,707 |
| 2019 | $6,802 | $514,997 | $154,499 | $360,498 |
| 2018 | $6,676 | $504,900 | $151,470 | $353,430 |
| 2017 | $6,104 | $459,000 | $137,700 | $321,300 |
| 2016 | $5,032 | $373,422 | $149,365 | $224,057 |
| 2015 | $4,952 | $367,815 | $147,122 | $220,693 |
| 2014 | $4,730 | $360,612 | $144,241 | $216,371 |
Source: Public Records
Agents Affiliated with this Home
-
Jenifer Rallo
J
Seller's Agent in 2022
Jenifer Rallo
Dream Realty
(714) 650-0010
27 Total Sales
-
D
Seller's Agent in 2017
Diane Radu
Windermere Homes & Estates
-
Buyer's Agent in 2017
Jon McGihon
Bennion Deville Homes
(760) 861-0350
53 Total Sales
-
June Johnson
Seller's Agent in 2016
June Johnson
Keller Williams Realty
(760) 285-2073
13 Total Sales
Map
Source: California Regional Multiple Listing Service (CRMLS)
MLS Number: SW22024165
APN: 630-073-001
Disclaimer: Certain information contained herein is derived from information provided by parties other than Homes.com. All information provided is deemed reliable, but is not guaranteed to be accurate and should be independently verified.
![]() The multiple listing data appearing on this website, or contained in reports produced therefrom, is owned and copyrighted by California Regional Multiple Listing Service, Inc. ("CRMLS") and is protected by all applicable copyright laws. Information provided is for viewer's personal, non-commercial use and may not be used for any purpose other than to identify prospective properties the viewer may be interested in purchasing. All listing data, including but not limited to square footage and lot size is believed to be accurate, but the listing Agent, listing Broker and CRMLS and its affiliates do not warrant or guarantee such accuracy. The viewer should independently verify the listed data prior to making any decisions based on such information by personal inspection and/or contacting a real estate professional.
The multiple listing data appearing on this website, or contained in reports produced therefrom, is owned and copyrighted by California Regional Multiple Listing Service, Inc. ("CRMLS") and is protected by all applicable copyright laws. Information provided is for viewer's personal, non-commercial use and may not be used for any purpose other than to identify prospective properties the viewer may be interested in purchasing. All listing data, including but not limited to square footage and lot size is believed to be accurate, but the listing Agent, listing Broker and CRMLS and its affiliates do not warrant or guarantee such accuracy. The viewer should independently verify the listed data prior to making any decisions based on such information by personal inspection and/or contacting a real estate professional.
Based on information from California Regional Multiple Listing Service, Inc. and /or other sources. All data, including all measurements and calculations of area, is obtained from various sources and has not been, and will not be, verified by broker or MLS. All information should be independently reviewed and verified for accuracy. Properties may or may not be listed by the office/agent presenting the information
Nearby Homes
- 72850 Tamarisk St
- 72948 Willow St
- 73005 Pancho Segura Ln
- 72917 Arthur Ashe Ln
- 72847 Don Larson Ln
- 72853 Don Larson Ln
- 73217 Rod Laver Ln
- 73225 Rod Laver Ln
- 73300 Willow St
- 73233 Rod Laver Ln
- 73162 Bill Tilden Ln
- 73242 Don Budge Ln
- 72950 Amber St
- 73247 Rod Laver Ln
- 46781 Highway 74 Unit 3
- 72725 Jack Kramer Ln
- 46835 Highway 74 Unit 3
- 72732 Tony Trabert Ln
- 46300 Desert Lily Dr
- 46917 Highway 74 Unit 3
- 72977 Bursera Way
- 72997 Bursera Way
- 72957 Bursera Way Unit 32
- 72957 Bursera Way
- 72980 Tamarisk St
- 72956 Tamarisk St
- 73015 Bursera Way
- 72976 Bursera Way
- 72996 Bursera Way Unit 12
- 72996 Bursera Way
- 72939 Bursera Way
- 72944 Tamarisk St
- 72956 Bursera Way
- 73016 Bursera Way
- 73067 Bursera Way
- 72928 Tamarisk St
- 72919 Bursera Way
- 72938 Bursera Way
- 0 Bursera Way Unit 214084670DA
- 0 Bursera Way Unit 215023428