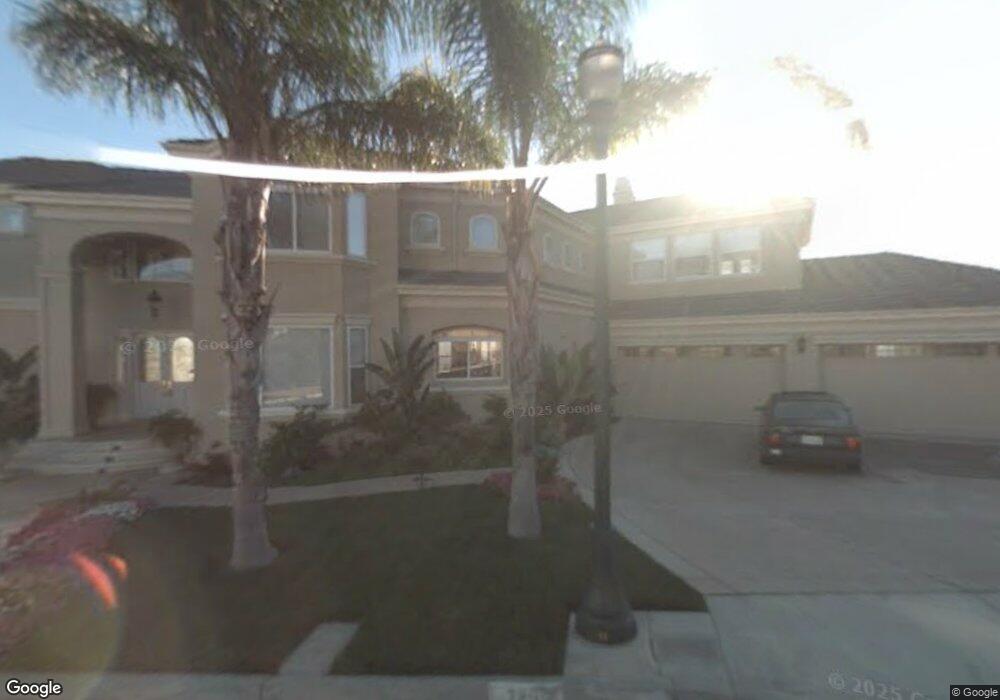
7299 Glenview Dr San Jose, CA 95120
Country View Estates NeighborhoodEstimated Value: $3,321,000 - $4,563,000
4
Beds
5
Baths
5,184
Sq Ft
$776/Sq Ft
Est. Value
About This Home
This home is located at 7299 Glenview Dr, San Jose, CA 95120 and is currently estimated at $4,024,916, approximately $776 per square foot. 7299 Glenview Dr is a home located in Santa Clara County with nearby schools including Williams Elementary School, Bret Harte Middle School, and Leland High School.
Ownership History
Date
Name
Owned For
Owner Type
Purchase Details
Closed on
Oct 18, 2021
Sold by
Nader And Soudabaeh Salehomoum Trust and Salehomoum Nader
Bought by
Salehomoum Family Trust and Soudabeh Salehomoum Separate Property Trust
Current Estimated Value
Purchase Details
Closed on
Oct 5, 2007
Sold by
Salehomoum Nader and Salehomoum Soudabeh
Bought by
Salehomoum Nader and Salehomoum Soudabeh
Purchase Details
Closed on
Feb 22, 2001
Sold by
Gb Estate Homes Llc
Bought by
Salehomoum Nader and Salehomoum Soudabeh
Home Financials for this Owner
Home Financials are based on the most recent Mortgage that was taken out on this home.
Original Mortgage
$1,001,000
Interest Rate
6.37%
Mortgage Type
Purchase Money Mortgage
Purchase Details
Closed on
Apr 15, 1999
Sold by
Shapell Industries Inc
Bought by
Gb Estate Homes Llc
Create a Home Valuation Report for This Property
The Home Valuation Report is an in-depth analysis detailing your home's value as well as a comparison with similar homes in the area
Home Values in the Area
Average Home Value in this Area
Purchase History
We collect this data history from publicly available records. To have your information removed, we recommend requesting removal directly through your county’s website.
| Date | Buyer | Sale Price | Title Company |
|---|---|---|---|
| Salehomoum Family Trust | -- | None Listed On Document | |
| Salehomoum Nader | -- | None Available | |
| Salehomoum Nader | $2,175,000 | Chicago Title Co | |
| Gb Estate Homes Llc | $423,000 | Chicago Title Co |
Source: Public Records
Mortgage History
We collect this data history from publicly available records. To have your information removed, we recommend requesting removal directly through your county’s website.
| Date | Status | Borrower | Loan Amount |
|---|---|---|---|
| Previous Owner | Salehomoum Nader | $1,001,000 |
Source: Public Records
Tax History
| Year | Tax Paid | Tax Assessment Tax Assessment Total Assessment is a certain percentage of the fair market value that is determined by local assessors to be the total taxable value of land and additions on the property. | Land | Improvement |
|---|---|---|---|---|
| 2025 | $37,833 | $3,213,125 | $1,588,097 | $1,625,028 |
| 2024 | $37,833 | $3,150,123 | $1,556,958 | $1,593,165 |
| 2023 | $37,135 | $3,088,357 | $1,526,430 | $1,561,927 |
| 2022 | $36,887 | $3,027,801 | $1,496,500 | $1,531,301 |
| 2021 | $36,277 | $2,968,433 | $1,467,157 | $1,501,276 |
| 2020 | $35,583 | $2,937,997 | $1,452,114 | $1,485,883 |
| 2019 | $34,891 | $2,880,391 | $1,423,642 | $1,456,749 |
| 2018 | $34,604 | $2,823,914 | $1,395,728 | $1,428,186 |
| 2017 | $34,368 | $2,768,544 | $1,368,361 | $1,400,183 |
| 2016 | $34,037 | $2,714,260 | $1,341,531 | $1,372,729 |
| 2015 | $33,860 | $2,673,490 | $1,321,380 | $1,352,110 |
| 2014 | -- | $2,621,121 | $1,295,496 | $1,325,625 |
Source: Public Records
Map
Nearby Homes
- 1059 Quail Creek Cir
- 1120 Valley Quail Cir
- 1257 Quail Creek Cir
- 7111 Echo Loop
- 7150 Calcaterra Dr
- 1222 Linder Hill Ln
- 1246 Charise Ct
- 1136 Carnforth Ct
- 1232 Copper Peak Ln
- 1122 Kendal Ct
- 1104 Pippin Creek Ct
- 7013 Silver Fox Dr
- 21287 Almaden Rd
- 20300 Almaden Rd
- 6894 Serenity Ct
- 1103 Barnes Ln
- 1112 Grimley Ln
- 1121 Corvallis Dr
- 6805 Almaden Rd
- 7042 Elmsdale Dr
- 7293 Glenview Dr
- 7305 Glenview Dr
- 7294 Glenview Dr
- 7300 Glenview Dr
- 7304 Glenview Dr
- 7287 Glenview Dr
- 7286 Glenview Dr
- 7311 Glenview Dr
- 7281 Glenview Dr
- 7308 Glenview Dr
- 1227 Eagle Valley Ct
- 7330 Glenview Dr
- 7310 Glenview Dr
- 7280 Glenview Dr
- 7275 Glenview Dr
- 1221 Eagle Valley Ct
- 1212 Eagle Valley Ct
- 7312 Glenview Dr
- 7318 Glenview Dr
- 1215 Eagle Valley Ct
Your Personal Tour Guide
Ask me questions while you tour the home.