S
Landlord's Agent in 2019
Shatara Moore
Progress Residential Property
Estimated Value: $194,027 - $241,000
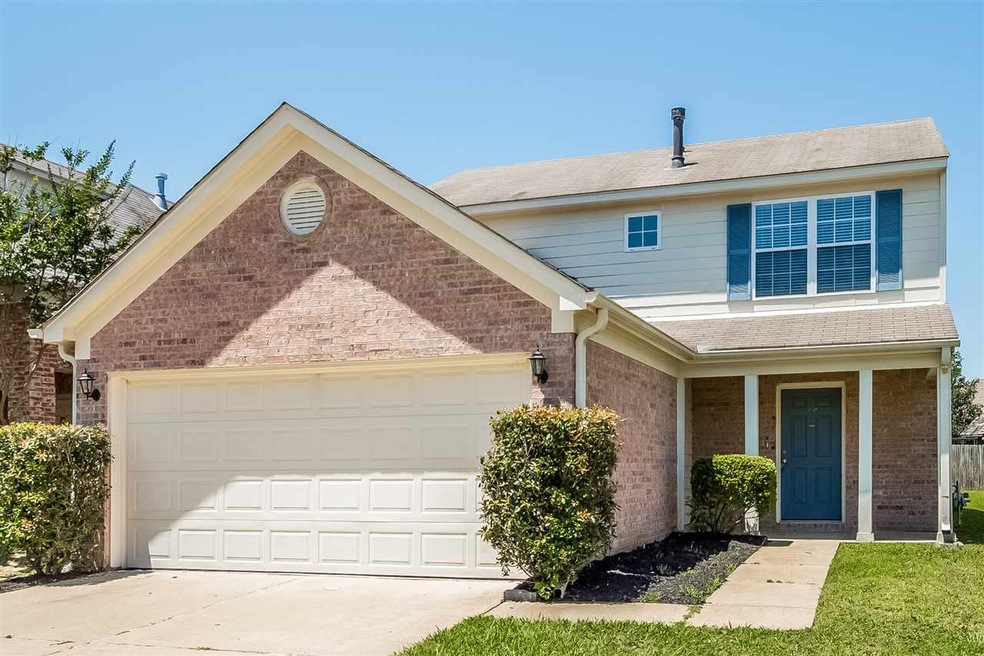
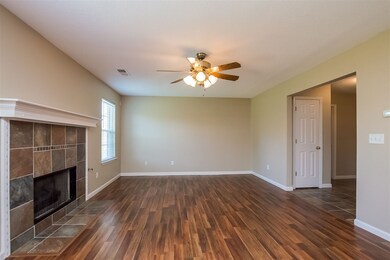
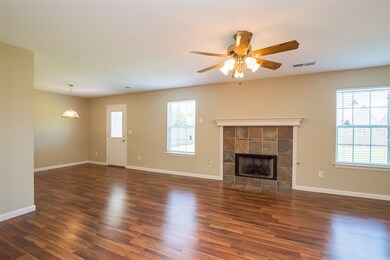
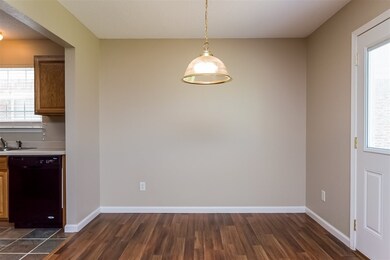
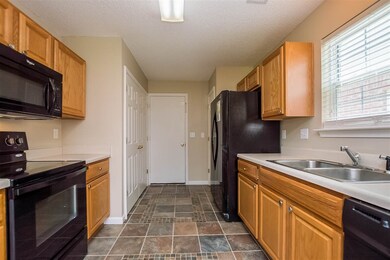
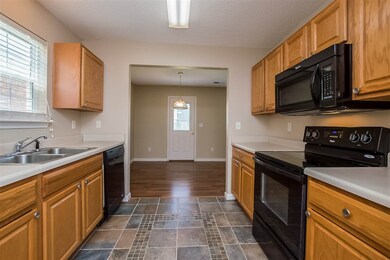
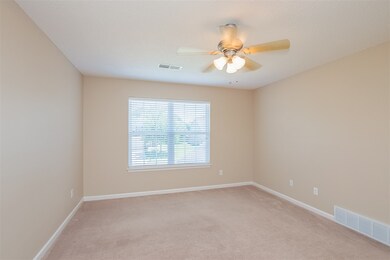
This 3 bedroom 2.5 bathroom home features an open floor plan, lovely living room with a fireplace to relax by, spacious eat-in kitchen with plenty of cabinets, dual sinks and a pantry for extra storage, nice size bedrooms and secondary rooms.
Last Agent to Rent the Property
Shatara Moore
Progress Residential Property License #325194 Listed on: 04/01/2019
Last Renter's Agent
NON-MLS NON-BOARD AGENT
NON-MLS OR NON-BOARD OFFICE
| Date | Buyer | Sale Price | Title Company |
|---|---|---|---|
| Pmc Sfr Borrower Llc | -- | Os National Llc | |
| Pretium Sfr Holding | -- | Attorney |
| Date | Event | Price | List to Sale | Price per Sq Ft |
|---|---|---|---|---|
| 07/08/2019 07/08/19 | Rented | $1,425 | 0.0% | -- |
| 06/27/2019 06/27/19 | Under Contract | -- | -- | -- |
| 06/17/2019 06/17/19 | For Rent | $1,425 | 0.0% | -- |
| 06/17/2019 06/17/19 | Price Changed | $1,425 | -0.3% | $1 / Sq Ft |
| 06/12/2019 06/12/19 | Under Contract | -- | -- | -- |
| 06/10/2019 06/10/19 | For Rent | $1,430 | 0.0% | -- |
| 06/10/2019 06/10/19 | Price Changed | $1,430 | -0.3% | $1 / Sq Ft |
| 06/03/2019 06/03/19 | Under Contract | -- | -- | -- |
| 05/30/2019 05/30/19 | Price Changed | $1,435 | +2.9% | $1 / Sq Ft |
| 05/17/2019 05/17/19 | Price Changed | $1,395 | -2.8% | $1 / Sq Ft |
| 05/15/2019 05/15/19 | Price Changed | $1,435 | +1.4% | $1 / Sq Ft |
| 05/10/2019 05/10/19 | Price Changed | $1,415 | +1.4% | $1 / Sq Ft |
| 05/03/2019 05/03/19 | Price Changed | $1,395 | -0.4% | $1 / Sq Ft |
| 04/17/2019 04/17/19 | Price Changed | $1,400 | +0.7% | $1 / Sq Ft |
| 04/10/2019 04/10/19 | Price Changed | $1,390 | +0.7% | $1 / Sq Ft |
| 04/02/2019 04/02/19 | Price Changed | $1,380 | +1.1% | $1 / Sq Ft |
| 04/01/2019 04/01/19 | For Rent | $1,365 | -- | -- |
| Year | Tax Paid | Tax Assessment Tax Assessment Total Assessment is a certain percentage of the fair market value that is determined by local assessors to be the total taxable value of land and additions on the property. | Land | Improvement |
|---|---|---|---|---|
| 2025 | $1,827 | $15,782 | $3,750 | $12,032 |
| 2024 | $1,645 | $12,051 | $3,750 | $8,301 |
| 2023 | $1,645 | $12,051 | $0 | $0 |
| 2022 | $1,645 | $12,051 | $3,750 | $8,301 |
| 2021 | $2,271 | $16,638 | $3,750 | $12,888 |
| 2020 | $2,113 | $15,485 | $3,750 | $11,735 |
| 2019 | $2,113 | $15,485 | $3,750 | $11,735 |
| 2017 | $2,080 | $26,572 | $15,161 | $11,411 |
| 2016 | $1,387 | $10,107 | $2,500 | $7,607 |
| 2015 | $1,387 | $17,714 | $10,107 | $7,607 |
| 2014 | $1,120 | $10,349 | $0 | $0 |
| 2013 | $1,046 | $10,349 | $0 | $0 |
S
Landlord's Agent in 2019
Shatara Moore
Progress Residential Property
N
Tenant's Agent in 2019
NON-MLS NON-BOARD AGENT
NON-MLS OR NON-BOARD OFFICE
Source: Memphis Area Association of REALTORS®
MLS Number: 10049209
APN: 1068270400002000
Disclaimer: Certain information contained herein is derived from information provided by parties other than Homes.com. All information provided is deemed reliable, but is not guaranteed to be accurate and should be independently verified.
![]() Listing content and images Copyright 2026 Memphis Area Association of REALTORS®. Information provided is for the consumer’s personal, non-commercial use and may not be used for any purpose other than to identify prospective properties consumers may be interested in purchasing. Do not rely upon listing data without independently verifying it.
Listing content and images Copyright 2026 Memphis Area Association of REALTORS®. Information provided is for the consumer’s personal, non-commercial use and may not be used for any purpose other than to identify prospective properties consumers may be interested in purchasing. Do not rely upon listing data without independently verifying it.
Some or all of the listings displayed may not belong to the firm whose website is being visited.
Ask me questions while you tour the home.