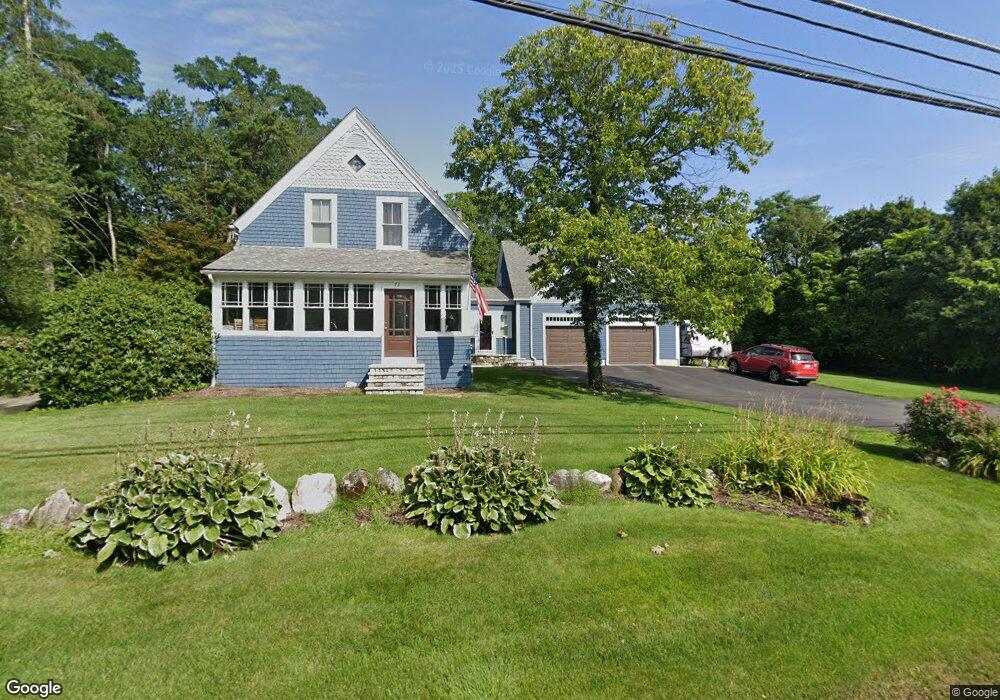
73 Dascomb Rd Andover, MA 01810
West Andover NeighborhoodEstimated Value: $876,000 - $936,000
4
Beds
1
Bath
1,939
Sq Ft
$467/Sq Ft
Est. Value
About This Home
This home is located at 73 Dascomb Rd, Andover, MA 01810 and is currently estimated at $905,442, approximately $466 per square foot. 73 Dascomb Rd is a home located in Essex County with nearby schools including Henry C. Sanborn Elementary School, Andover West Middle School, and Andover High School.
Ownership History
Date
Name
Owned For
Owner Type
Purchase Details
Closed on
Apr 11, 2024
Sold by
Williams Aaron and Williams Terry C
Bought by
A D & Tery C Williams Lt and Williams
Current Estimated Value
Purchase Details
Closed on
Feb 12, 2010
Sold by
Pitochelli Diane M Est and Mccormick
Bought by
Williams Aaron and Williams Terry Cardoza
Home Financials for this Owner
Home Financials are based on the most recent Mortgage that was taken out on this home.
Original Mortgage
$310,500
Interest Rate
5.12%
Mortgage Type
Purchase Money Mortgage
Create a Home Valuation Report for This Property
The Home Valuation Report is an in-depth analysis detailing your home's value as well as a comparison with similar homes in the area
Home Values in the Area
Average Home Value in this Area
Purchase History
| Date | Buyer | Sale Price | Title Company |
|---|---|---|---|
| A D & Tery C Williams Lt | -- | None Available | |
| A D & Tery C Williams Lt | -- | None Available | |
| Williams Aaron | $345,000 | -- | |
| Williams Aaron | $345,000 | -- |
Source: Public Records
Mortgage History
| Date | Status | Borrower | Loan Amount |
|---|---|---|---|
| Previous Owner | Williams Aaron | $330,000 | |
| Previous Owner | Williams Aaron | $310,500 |
Source: Public Records
Tax History Compared to Growth
Tax History
| Year | Tax Paid | Tax Assessment Tax Assessment Total Assessment is a certain percentage of the fair market value that is determined by local assessors to be the total taxable value of land and additions on the property. | Land | Improvement |
|---|---|---|---|---|
| 2024 | $10,125 | $786,100 | $425,900 | $360,200 |
| 2023 | $9,816 | $718,600 | $394,600 | $324,000 |
| 2022 | $9,213 | $631,000 | $334,500 | $296,500 |
| 2021 | $8,824 | $577,100 | $303,900 | $273,200 |
| 2020 | $8,466 | $564,000 | $296,500 | $267,500 |
| 2019 | $8,058 | $527,700 | $266,900 | $260,800 |
| 2018 | $7,477 | $478,100 | $251,600 | $226,500 |
| 2017 | $7,154 | $471,300 | $246,800 | $224,500 |
| 2016 | $6,985 | $471,300 | $246,800 | $224,500 |
| 2015 | $6,714 | $448,500 | $237,200 | $211,300 |
Source: Public Records
Map
Nearby Homes
- 4 Hazelwood Cir
- 18 Dale St Unit 4G
- 18 Bryan Ln Unit 18
- 3 West Hollow
- 105 Central St
- 103 Central St
- 58 Blanchard St
- 25 Timothy Dr
- 14 Regis Rd
- 69 Blanchard St
- 47 Abbot St
- 31 Porter Rd
- 14 Geneva Rd
- 15 Geneva Rd
- 56 Sunset Rock Rd
- 4 Hammond Way
- 40 Ballardvale Rd
- 22 Haggetts Pond Rd
- 5 Kensington Way Unit 5
- 50 Hidden Rd