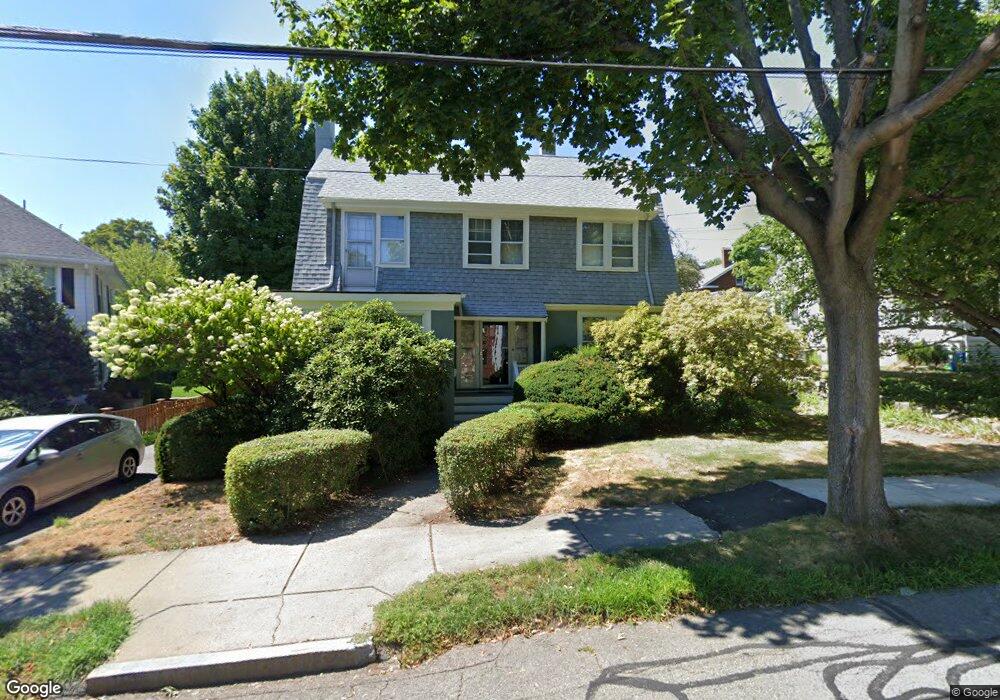
73 Davis Ave West Newton, MA 02465
West Newton NeighborhoodEstimated Value: $1,165,490 - $1,333,000
4
Beds
2
Baths
1,834
Sq Ft
$682/Sq Ft
Est. Value
About This Home
This home is located at 73 Davis Ave, West Newton, MA 02465 and is currently estimated at $1,251,123, approximately $682 per square foot. 73 Davis Ave is a home located in Middlesex County with nearby schools including Franklin Elementary School, Horace Mann Elementary School, and F.A. Day Middle School.
Ownership History
Date
Name
Owned For
Owner Type
Purchase Details
Closed on
Jun 25, 2025
Sold by
Solomon Frederic and Rohrlick Paula
Bought by
73 Davis Avenue Rt and Rohrlick
Current Estimated Value
Purchase Details
Closed on
Feb 11, 2004
Sold by
Edwards Robert Alan
Bought by
Solomon Fredric and Rohrlick Paula
Create a Home Valuation Report for This Property
The Home Valuation Report is an in-depth analysis detailing your home's value as well as a comparison with similar homes in the area
Home Values in the Area
Average Home Value in this Area
Purchase History
| Date | Buyer | Sale Price | Title Company |
|---|---|---|---|
| 73 Davis Avenue Rt | -- | -- | |
| 73 Davis Avenue Rt | -- | -- | |
| Solomon Fredric | $3,000 | -- | |
| Solomon Fredric | $3,000 | -- |
Source: Public Records
Mortgage History
| Date | Status | Borrower | Loan Amount |
|---|---|---|---|
| Previous Owner | Solomon Fredric | $74,900 | |
| Previous Owner | Solomon Fredric | $50,000 |
Source: Public Records
Tax History Compared to Growth
Tax History
| Year | Tax Paid | Tax Assessment Tax Assessment Total Assessment is a certain percentage of the fair market value that is determined by local assessors to be the total taxable value of land and additions on the property. | Land | Improvement |
|---|---|---|---|---|
| 2025 | $9,785 | $998,500 | $871,200 | $127,300 |
| 2024 | $9,461 | $969,400 | $845,800 | $123,600 |
| 2023 | $8,972 | $881,300 | $637,800 | $243,500 |
| 2022 | $8,584 | $816,000 | $590,600 | $225,400 |
| 2021 | $8,283 | $769,800 | $557,200 | $212,600 |
| 2020 | $8,037 | $769,800 | $557,200 | $212,600 |
| 2019 | $7,810 | $747,400 | $541,000 | $206,400 |
| 2018 | $7,468 | $690,200 | $489,800 | $200,400 |
| 2017 | $7,240 | $651,100 | $462,100 | $189,000 |
| 2016 | $6,925 | $608,500 | $431,900 | $176,600 |
| 2015 | $6,603 | $568,700 | $403,600 | $165,100 |
Source: Public Records
Map
Nearby Homes
- 429 Cherry St Unit 11
- 79 Chestnut St Unit 2
- 318 Austin St Unit A
- 66 Webster St
- 27 Cross St Unit 27
- 371 Cherry St
- 41 Kilburn Rd
- 12 Inis Cir
- 4 Hosmer Cir
- 12 Wiswall St
- 2 Elm St Unit 6
- 2 Elm St Unit 8
- 287 Cherry St Unit 2
- 106 River St Unit 18
- 106 River St Unit 2
- 106 River St Unit 14
- 4 Wiswall St
- 53-55 N Gate Park
- 44 Westland Ave
- 123 Mount Vernon St Unit 2
- 67 Davis Ave
- 77 Davis Ave
- 74 Davis Ave
- 61 Davis Ave
- 38 Eden Ave Unit 2
- 36 Eden Ave Unit 1
- 36 Eden Ave Unit 38
- 36 Eden Ave Unit A
- 42 Eden Ave
- 30-32 Eden Ave
- 30 Eden Ave Unit 32
- 68 Davis Ave
- 953 Watertown St
- 46 Eden Ave
- 923 Watertown St Unit 925
- 57 Davis Ave
- 934 Watertown St Unit 936
- 936 Watertown St Unit 2
- 934 Watertown St Unit 2
- 936 Watertown St Unit 1