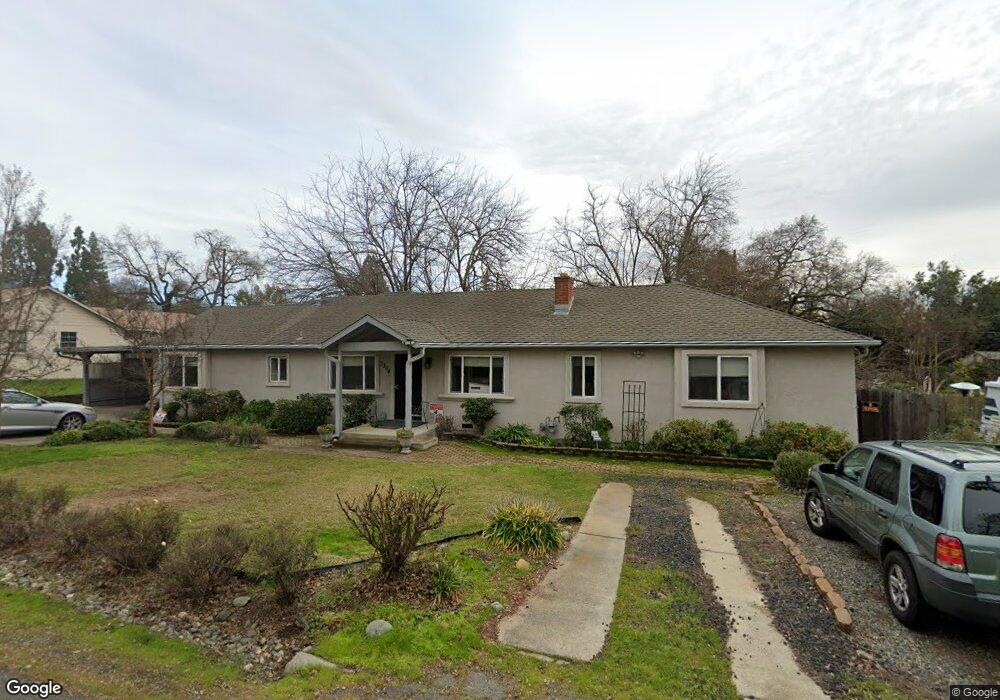
7304 Walnut Rd Fair Oaks, CA 95628
Estimated Value: $566,000 - $701,000
4
Beds
3
Baths
2,123
Sq Ft
$297/Sq Ft
Est. Value
About This Home
This home is located at 7304 Walnut Rd, Fair Oaks, CA 95628 and is currently estimated at $630,519, approximately $296 per square foot. 7304 Walnut Rd is a home located in Sacramento County with nearby schools including Albert Schweitzer Elementary School, John Barrett Middle School, and Del Campo High School.
Ownership History
Date
Name
Owned For
Owner Type
Purchase Details
Closed on
Dec 1, 2025
Sold by
Brovald Keith
Bought by
Keith Brovald Living Trust and Brovald
Current Estimated Value
Purchase Details
Closed on
Feb 4, 2022
Sold by
Brovald Melvin L
Bought by
Brovald Melvin L and Brovald Keith
Home Financials for this Owner
Home Financials are based on the most recent Mortgage that was taken out on this home.
Original Mortgage
$169,200
Interest Rate
2.77%
Mortgage Type
New Conventional
Purchase Details
Closed on
Sep 26, 2011
Sold by
Brovald Melvin L and Brovald Marsha M
Bought by
Brovald Melvin L and Brovald Marsha M
Purchase Details
Closed on
Aug 11, 2011
Sold by
Morris Craig and The Young Family Revocable Tru
Bought by
Brovald Marsha M
Purchase Details
Closed on
Mar 30, 2005
Sold by
Young Ellen and The Young Family Revocable Tru
Bought by
Brovald Melvin L and Brovald Marsha M
Purchase Details
Closed on
Jan 12, 2005
Sold by
Young Ellen and Brovald Melvin L
Bought by
Young Ellen and Young Family Revocable Trust
Purchase Details
Closed on
Apr 26, 2004
Sold by
Young Ellen and The Young Family Revocable Tru
Bought by
Brovald Melvin L and Brovald Marsha M
Home Financials for this Owner
Home Financials are based on the most recent Mortgage that was taken out on this home.
Original Mortgage
$195,000
Interest Rate
5.38%
Mortgage Type
Purchase Money Mortgage
Create a Home Valuation Report for This Property
The Home Valuation Report is an in-depth analysis detailing your home's value as well as a comparison with similar homes in the area
Home Values in the Area
Average Home Value in this Area
Purchase History
| Date | Buyer | Sale Price | Title Company |
|---|---|---|---|
| Keith Brovald Living Trust | -- | None Listed On Document | |
| Melvin Brovald Living Trust | -- | None Listed On Document | |
| Brovald Melvin L | -- | Commonwealth Land Title | |
| Brovald Melvin L | -- | None Available | |
| Brovald Marsha M | -- | None Available | |
| Brovald Melvin L | -- | -- | |
| Young Ellen | -- | -- | |
| Brovald Melvin L | -- | -- |
Source: Public Records
Mortgage History
| Date | Status | Borrower | Loan Amount |
|---|---|---|---|
| Previous Owner | Brovald Melvin L | $169,200 | |
| Previous Owner | Brovald Melvin L | $195,000 |
Source: Public Records
Tax History
| Year | Tax Paid | Tax Assessment Tax Assessment Total Assessment is a certain percentage of the fair market value that is determined by local assessors to be the total taxable value of land and additions on the property. | Land | Improvement |
|---|---|---|---|---|
| 2025 | $2,349 | $204,535 | $13,939 | $190,596 |
| 2024 | $2,349 | $200,525 | $13,666 | $186,859 |
| 2023 | $2,311 | $196,595 | $13,399 | $183,196 |
| 2022 | $2,348 | $192,741 | $13,137 | $179,604 |
| 2021 | $2,224 | $188,963 | $12,880 | $176,083 |
| 2020 | $2,182 | $187,026 | $12,748 | $174,278 |
| 2019 | $2,137 | $183,360 | $12,499 | $170,861 |
| 2018 | $2,111 | $179,765 | $12,254 | $167,511 |
| 2017 | $2,088 | $176,241 | $12,014 | $164,227 |
| 2016 | $1,950 | $172,786 | $11,779 | $161,007 |
| 2015 | $1,960 | $170,192 | $11,603 | $158,589 |
| 2014 | $1,919 | $166,859 | $11,376 | $155,483 |
Source: Public Records
Map
Nearby Homes
- 4310 Hussey Dr
- 7408 Santa Susana Way
- 4134-lot 1 Bannister Rd
- 4243 Glenridge Dr
- 4134 Bannister Rd
- 6996 Lincoln Creek Cir
- 7431 Heidi Ct
- 7100 Stella Ln Unit 1
- 7637 Vasos Way
- 6919 Lisa Marie Way
- 7204 Lynnbrook Ct
- 7055 Winding Way
- 4040 Minnesota Ave
- 4215 New York Ave
- 7786 Winding Way
- 6716 Rappahannock Way
- 7605 Sunset Ave
- 8204 Caminata Ln
- 4072 Porton Ln
- 4076 Porton Ln
- 7308 Walnut Rd
- 7250 Walnut Rd
- 4247 Oak Knoll Dr
- 4251 Oak Knoll Dr
- 4300 Eucalyptus Rd
- 4243 Oak Knoll Dr
- 7240 Walnut Rd
- 7320 Walnut Rd
- 4255 Oak Knoll Dr
- 4301 Eucalyptus Rd
- 7309 Walnut Rd
- 7238 Walnut Rd
- 4239 Oak Knoll Dr
- 4312 Eucalyptus Rd
- 4248 Oak Knoll Dr
- 4252 Oak Knoll Dr
- 7317 Walnut Rd
- 7239 Walnut Rd
- 4259 Oak Knoll Dr
- 4234 Oak Knoll Dr
Your Personal Tour Guide
Ask me questions while you tour the home.