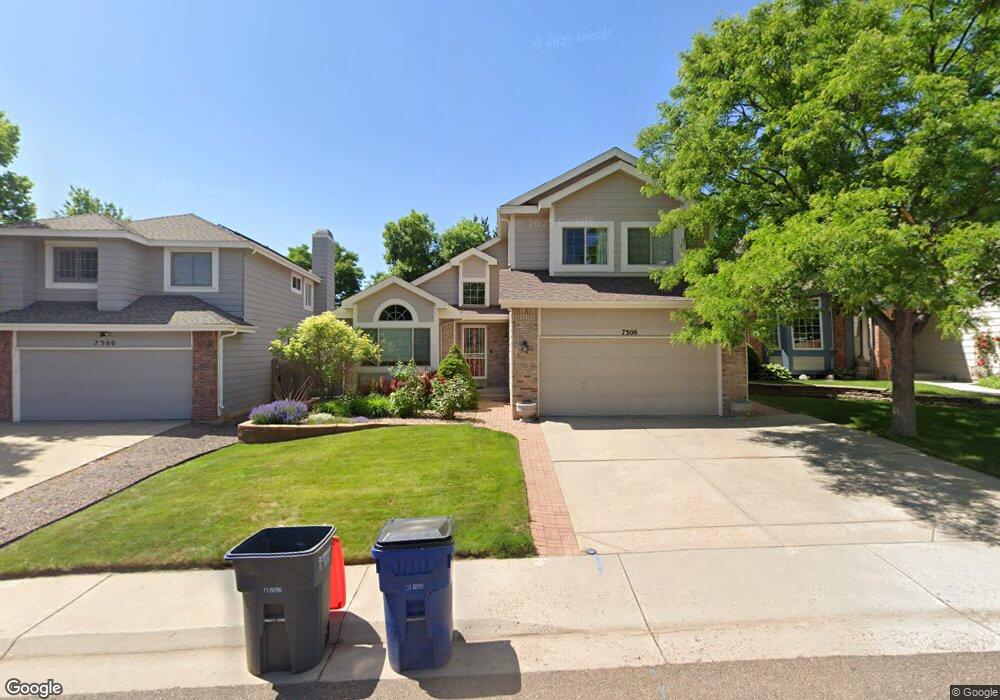
7306 S Pierson St Littleton, CO 80127
Meadows NeighborhoodEstimated Value: $735,095 - $800,000
4
Beds
4
Baths
2,889
Sq Ft
$266/Sq Ft
Est. Value
About This Home
This home is located at 7306 S Pierson St, Littleton, CO 80127 and is currently estimated at $769,024, approximately $266 per square foot. 7306 S Pierson St is a home located in Jefferson County with nearby schools including Ute Meadows Elementary School, Deer Creek Middle School, and Chatfield High School.
Ownership History
Date
Name
Owned For
Owner Type
Purchase Details
Closed on
Apr 10, 2014
Sold by
Crockett Brian E
Bought by
Crockett Brian E and Crockett April Dawn
Current Estimated Value
Purchase Details
Closed on
Oct 11, 2012
Sold by
Martch Nancy Ann
Bought by
Crockett Brian A
Home Financials for this Owner
Home Financials are based on the most recent Mortgage that was taken out on this home.
Original Mortgage
$292,103
Outstanding Balance
$203,033
Interest Rate
3.59%
Mortgage Type
New Conventional
Estimated Equity
$565,991
Purchase Details
Closed on
Apr 21, 2010
Sold by
Martch Nancy Ann and Folcik Nancy M
Bought by
Martch Nancy Ann
Home Financials for this Owner
Home Financials are based on the most recent Mortgage that was taken out on this home.
Original Mortgage
$195,000
Interest Rate
4.75%
Mortgage Type
New Conventional
Purchase Details
Closed on
Mar 22, 2010
Sold by
Folcik James J and Folcik Nancy M
Bought by
Martch Nancy Ann and Folcik Nancy M
Home Financials for this Owner
Home Financials are based on the most recent Mortgage that was taken out on this home.
Original Mortgage
$195,000
Interest Rate
4.75%
Mortgage Type
New Conventional
Purchase Details
Closed on
Nov 19, 2009
Sold by
Marsh Jeffrey D and Marsh Mary Sue
Bought by
Folcik James L and Folcik Nancy M
Home Financials for this Owner
Home Financials are based on the most recent Mortgage that was taken out on this home.
Original Mortgage
$186,000
Interest Rate
4.83%
Mortgage Type
New Conventional
Purchase Details
Closed on
Nov 28, 2001
Sold by
Williams Wesley A and Williams Phyllis J
Bought by
Marsh Jeffrey D and Marsh Mary Sue
Home Financials for this Owner
Home Financials are based on the most recent Mortgage that was taken out on this home.
Original Mortgage
$199,960
Interest Rate
5.5%
Purchase Details
Closed on
Feb 23, 1996
Sold by
Gaylord Jason A
Bought by
Williams Wesley A and Williams Phyllis J
Home Financials for this Owner
Home Financials are based on the most recent Mortgage that was taken out on this home.
Original Mortgage
$171,495
Interest Rate
7.01%
Mortgage Type
VA
Purchase Details
Closed on
Feb 22, 1995
Sold by
Rohm Joanna Elizabeth and Rohm Joanna E
Bought by
Gaylord Jason A
Home Financials for this Owner
Home Financials are based on the most recent Mortgage that was taken out on this home.
Original Mortgage
$139,500
Interest Rate
9%
Create a Home Valuation Report for This Property
The Home Valuation Report is an in-depth analysis detailing your home's value as well as a comparison with similar homes in the area
Home Values in the Area
Average Home Value in this Area
Purchase History
| Date | Buyer | Sale Price | Title Company |
|---|---|---|---|
| Crockett Brian E | -- | Capital Title Llc | |
| Crockett Brian A | $343,650 | Land Title Guarantee Company | |
| Martch Nancy Ann | -- | Land Title Guarantee Company | |
| Martch Nancy Ann | -- | None Available | |
| Folcik James L | $310,000 | Land Title Guarantee Company | |
| Marsh Jeffrey D | $249,950 | -- | |
| Williams Wesley A | $166,500 | -- | |
| Gaylord Jason A | $155,000 | Title America |
Source: Public Records
Mortgage History
| Date | Status | Borrower | Loan Amount |
|---|---|---|---|
| Open | Crockett Brian A | $292,103 | |
| Previous Owner | Martch Nancy Ann | $195,000 | |
| Previous Owner | Folcik James L | $186,000 | |
| Previous Owner | Marsh Jeffrey D | $199,960 | |
| Previous Owner | Williams Wesley A | $171,495 | |
| Previous Owner | Gaylord Jason A | $139,500 |
Source: Public Records
Tax History Compared to Growth
Tax History
| Year | Tax Paid | Tax Assessment Tax Assessment Total Assessment is a certain percentage of the fair market value that is determined by local assessors to be the total taxable value of land and additions on the property. | Land | Improvement |
|---|---|---|---|---|
| 2024 | $3,905 | $39,868 | $10,897 | $28,971 |
| 2023 | $3,905 | $39,868 | $10,897 | $28,971 |
| 2022 | $3,558 | $35,671 | $9,606 | $26,065 |
| 2021 | $3,604 | $36,697 | $9,882 | $26,815 |
| 2020 | $3,190 | $32,559 | $7,914 | $24,645 |
| 2019 | $3,150 | $32,559 | $7,914 | $24,645 |
| 2018 | $2,896 | $28,903 | $8,106 | $20,797 |
| 2017 | $2,643 | $28,903 | $8,106 | $20,797 |
| 2016 | $2,727 | $28,775 | $7,466 | $21,309 |
| 2015 | $2,329 | $28,775 | $7,466 | $21,309 |
| 2014 | $2,329 | $23,049 | $6,468 | $16,581 |
Source: Public Records
Map
Nearby Homes
- 7413 S Quail Cir Unit 1422
- 7433 S Quail Cir Unit 1924
- 7462 S Quail Cir Unit 426
- 11434 W Roxbury Dr
- 7339 S Gore Range Rd
- 7369 S Gore Range Rd Unit 208
- 11412 W Roxbury Place
- 7646 S Bear Mountain
- 7474 S Alkire St Unit 203
- 11673 Elk Head Range Rd
- 11703 Elk Head Range Rd
- 11235 San Joaquin Ridge
- 7409 S Alkire St Unit 304
- 10656 W Rowland Ave
- 11710 Elk Head Range Rd
- 7359 S Mount Holy Cross
- 10675 W Rowland Ave
- 7355 S Alkire St Unit 203
- 11872 Elk Head Range Rd
- 10371 W Indore Dr
- 7316 S Pierson St
- 7300 S Pierson St
- 7320 S Pierson St
- 7296 S Pierson St
- 7326 S Pierson St
- 11105 W Glasgow Ave
- 7290 S Pierson St
- 7330 S Pierson St
- 7286 S Pierson St
- 7327 S Pierson St
- 11104 W Geddes Ave
- 7482 S Quail Cir Unit 721
- 7482 S Quail Cir Unit 723
- 7482 S Quail Cir Unit 725
- 7482 S Quail Cir Unit 727
- 7482 S Quail Cir Unit 718
- 7482 S Quail Cir Unit 716
- 7482 S Quail Cir Unit 714
- 7482 S Quail Cir Unit 712
- 7482 S Quail Cir Unit 722