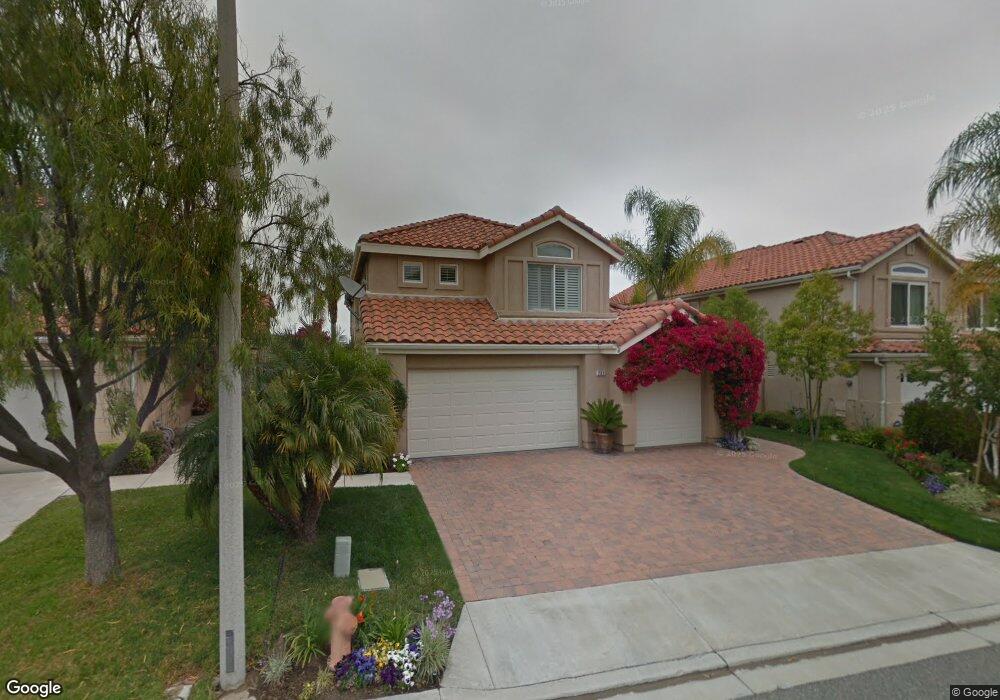
731 Arvada Ct Simi Valley, CA 93065
Wood Ranch NeighborhoodEstimated Value: $1,032,772 - $1,166,000
4
Beds
3
Baths
2,577
Sq Ft
$421/Sq Ft
Est. Value
About This Home
This home is located at 731 Arvada Ct, Simi Valley, CA 93065 and is currently estimated at $1,083,943, approximately $420 per square foot. 731 Arvada Ct is a home located in Ventura County with nearby schools including Wood Ranch Elementary School, Sinaloa Middle School, and Royal High School.
Ownership History
Date
Name
Owned For
Owner Type
Purchase Details
Closed on
Aug 8, 2025
Sold by
Kelly Craig J and Baiera-Kelly Toni J
Bought by
Craig J Kelly Trust and Baiera-Kelly Trust
Current Estimated Value
Purchase Details
Closed on
Nov 15, 2016
Sold by
Kelly Craig J
Bought by
Kelly Craig J
Purchase Details
Closed on
Aug 11, 1997
Sold by
Werre Ronald and Werre Patricia M
Bought by
Kelly Craig J and Baiera Kelly Toni J
Home Financials for this Owner
Home Financials are based on the most recent Mortgage that was taken out on this home.
Original Mortgage
$165,000
Interest Rate
7.45%
Purchase Details
Closed on
Oct 30, 1995
Sold by
M J Brock & Sons Inc
Bought by
Werre Ronald and Werre Patricia M
Home Financials for this Owner
Home Financials are based on the most recent Mortgage that was taken out on this home.
Original Mortgage
$278,640
Interest Rate
7.37%
Create a Home Valuation Report for This Property
The Home Valuation Report is an in-depth analysis detailing your home's value as well as a comparison with similar homes in the area
Home Values in the Area
Average Home Value in this Area
Purchase History
| Date | Buyer | Sale Price | Title Company |
|---|---|---|---|
| Craig J Kelly Trust | -- | None Listed On Document | |
| Kelly Craig J | -- | None Listed On Document | |
| Kelly Craig J | -- | None Listed On Document | |
| Kelly Craig J | -- | Accommodation | |
| Kelly Craig J | $315,000 | Investors Title Company | |
| Werre Ronald | $298,000 | First American Title Ins Co |
Source: Public Records
Mortgage History
| Date | Status | Borrower | Loan Amount |
|---|---|---|---|
| Previous Owner | Kelly Craig J | $165,000 | |
| Previous Owner | Werre Ronald | $278,640 |
Source: Public Records
Tax History Compared to Growth
Tax History
| Year | Tax Paid | Tax Assessment Tax Assessment Total Assessment is a certain percentage of the fair market value that is determined by local assessors to be the total taxable value of land and additions on the property. | Land | Improvement |
|---|---|---|---|---|
| 2025 | $6,220 | $511,196 | $204,367 | $306,829 |
| 2024 | $6,220 | $501,173 | $200,360 | $300,813 |
| 2023 | $5,848 | $491,347 | $196,432 | $294,915 |
| 2022 | $5,825 | $481,713 | $192,580 | $289,133 |
| 2021 | $5,782 | $472,268 | $188,804 | $283,464 |
| 2020 | $5,662 | $467,427 | $186,869 | $280,558 |
| 2019 | $5,404 | $458,262 | $183,205 | $275,057 |
| 2018 | $5,358 | $449,277 | $179,613 | $269,664 |
| 2017 | $5,239 | $440,469 | $176,092 | $264,377 |
| 2016 | $5,003 | $431,834 | $172,640 | $259,194 |
| 2015 | $4,898 | $425,349 | $170,048 | $255,301 |
| 2014 | $4,829 | $417,019 | $166,718 | $250,301 |
Source: Public Records
Map
Nearby Homes
- 625 Sedgeworth Ct
- 650 Twin Peaks Ave
- 368 Pellburne Ct
- 335 Kitetail St
- 3178 Sunset Hills Blvd
- 596 Fenwick Way Unit C
- 713 Twillin Ct
- 272 Fieldstone Way Unit A
- 2996 Eagles Claw Ave
- 264 Ridgeton Ln Unit D
- 287 Goldenwood Cir
- 440 Huyler Ln Unit C
- 286 Golden Fern Ct
- 2980 Blazing Star Dr
- 951 Firestone Cir
- 808 Links View Dr
- 2457 Rutland Place
- 2733 Rocky Point Ct
- 630 Kingswood Ln Unit F
- 600 Kingswood Ln Unit G
- 719 Arvada Ct
- 743 Arvada Ct
- 755 Arvada Ct
- 707 Arvada Ct
- 734 Cranmont Ct
- 746 Cranmont Ct
- 728 Cranmont Ct
- 758 Cranmont Ct
- 767 Arvada Ct
- 742 Arvada Ct
- 704 Cranmont Ct
- 754 Arvada Ct
- 718 Arvada Ct
- 764 Cranmont Ct
- 706 Arvada Ct
- 779 Arvada Ct
- 778 Arvada Ct
- 776 Cranmont Ct
- 336 Cliffhollow Ct
- 344 Cliffhollow Ct